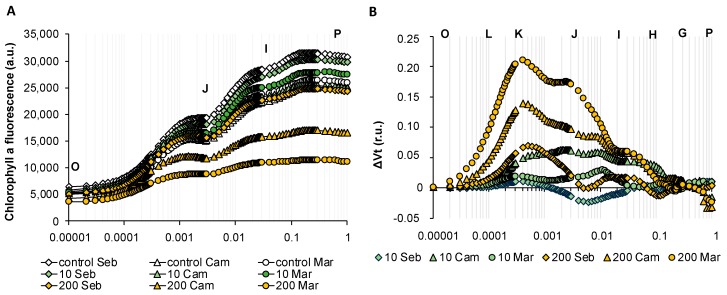
Figure 10.
Chlorophyll a fluorescence induction curves of barley in response to different Abscisic Acid (ABA) concentrations during early seedling development. (A) The effects of ABA on the OJIP transients of the genotypes studied. (B) The effects of ABA on the relative variable fluorescence (ΔVt) of the genotypes studied. Values are means (n = 15). r.u.—Relative units.

