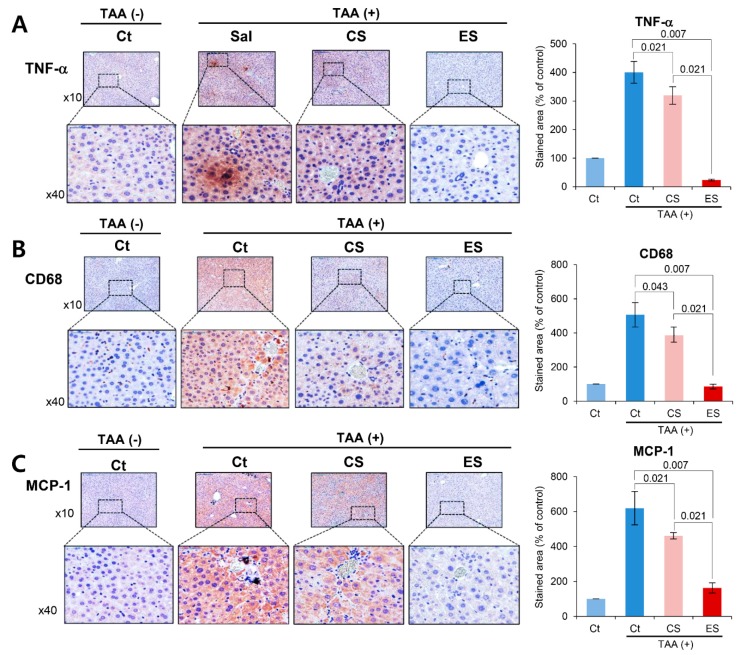
Figure 4.
Immunohistochemistry of inflammatory markers in the liver specimens. (A) CD68 immunohistochemistry of the livers in each group. The etanercept-secretome group showed the significant lower expression of CD68. (B) TNF-α immunohistochemistry of the livers in each group. The etanercept-secretome group showed the significant lower expression of TNF-α. (C) MCP-1 immunohistochemistry of the livers in each group. The etanercept-secretome group showed the significant lower expression of MCP-1. The percentages of immunoreactive areas were measured using NIH image J and expressed as values relative to those from normal livers. Values are presented as mean ± standard deviation of three independent experiments. Abbreviations: CS, secretome obtained from empty vector-transfected ASCs; Ct, control; ES, etanercept-secretome (secretome obtained from etanercept-synthesizing ASCs); MCP-1, monocyte chemoattract protein-1; Sal, saline injection group; TNF-α, tumor necrosis factor-α.

