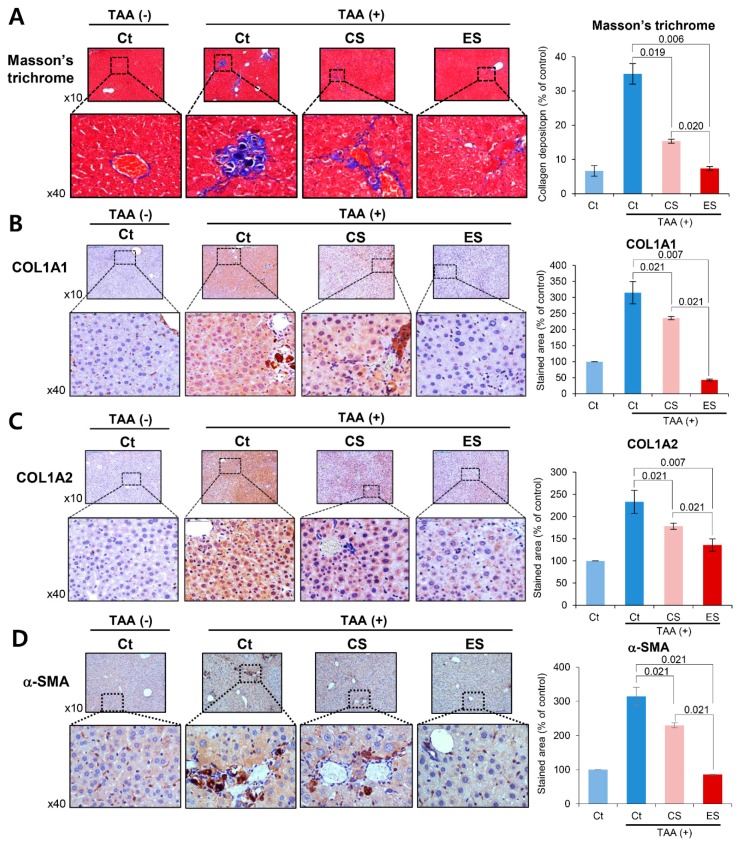
Figure 5.
Special histological stains reflecting the degree of fibrosis in the livers in each group. (A) Masson’s trichrome staining of each group on the seventh day post-injection. Percentages of fibrotic areas were estimated using NIH image J. (B,C) COL1A1 and COL1A2 immunohistochemistry of the livers on the seventh day post-injection for the determination of the collagen content in each group. (D) α-SMA immunohistochemistry of the livers on the seventh day post-injection for the indirect localization of activated HSCs in each group. Percentages of immunoreactive areas were estimated using NIH image J. The values are presented as mean ± standard deviation of three independent experiments. Abbreviations: α-SMA, alpha smooth muscle actin; COL1A1, collagen type 1 alpha1; COL1A2, collagen type 1 alpha2; CS, secretome obtained from empty vector-transfected ASCs; Ct, control; ES, etanercept-secretome (secretome obtained from etanercept-synthesizing ASCs); Sal, saline injection group.

