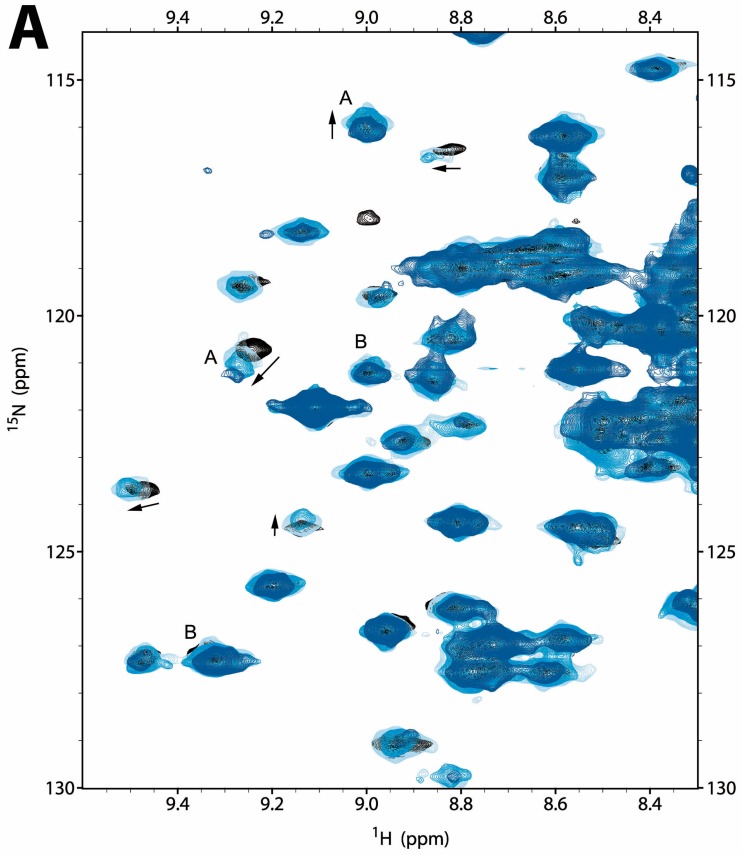
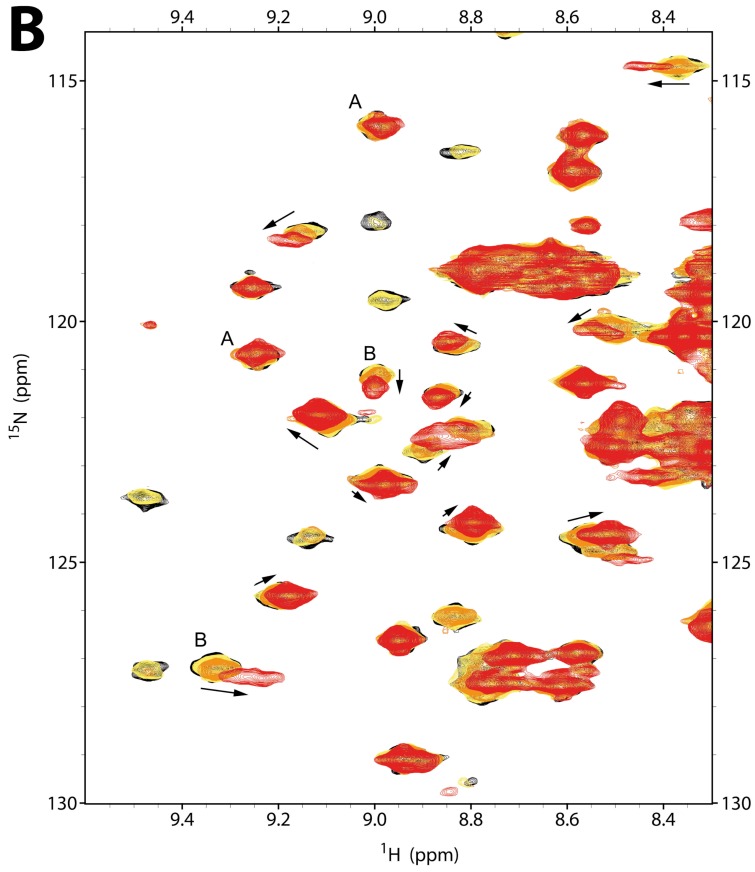
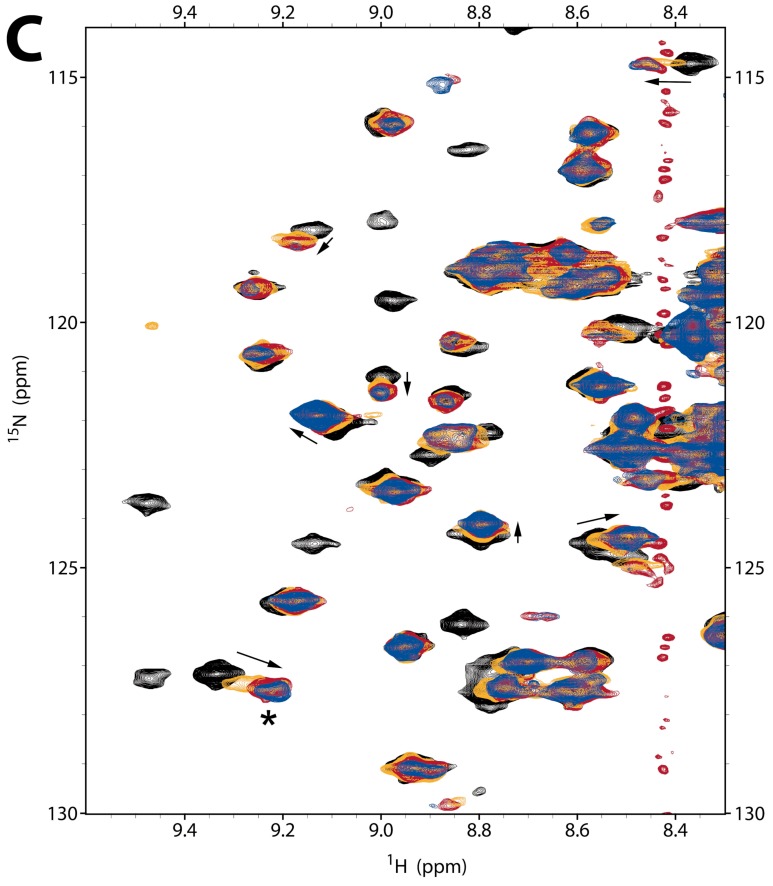
Figure 2.
Ligand binding by hCNNM4BAT (100 μM), monitored by 2D 15N HSQC NMR spectra (zoom on a representative region). (A) Effect of Mg2+ addition to a final concentration of 0 mM (black, reference), 10 mM (light blue), 20 mM (blue), and 40 mM (dark blue). Signals shifting or diminishing due to addition of only Mg2+ or ADPNP (as in (B)) are marked with letters A or B, respectively, to emphasize differences in the affected signal sets, indicating non-overlapping binding sites. Arrows show the shift direction. (B) Effect of ADPNP addition to a final concentration of 0 mM (black, reference), 570 μM (yellow), 1.14 mM (orange), and 5.7 mM (red). (C) Effect of combined Mg2+ and ADPNP addition: Mg2+ plus 0 mM ADPNP (black, reference), 0 mM Mg2+ plus 5.7 mM ADPNP (orange), 0 mM Mg2+ plus 18 mM ADPNP (red), and 10 mM Mg2+ plus 5.7 mM ADPNP (blue). Moderate concentrations of ADPNP (5.7 mM) in the presence of Mg2+ produce an effect similar to the addition of high concentrations of ADPNP alone (18 mM; a representative signal is marked by an asterisk). The pertaining full spectra are shown in Figure S2A–C. Spurious t1 noise at 1H frequencies of ca. 8.2 and 8.4 ppm derive from protons H2 and H8 in the purine ring of ADPNP (see Figure S2D).


