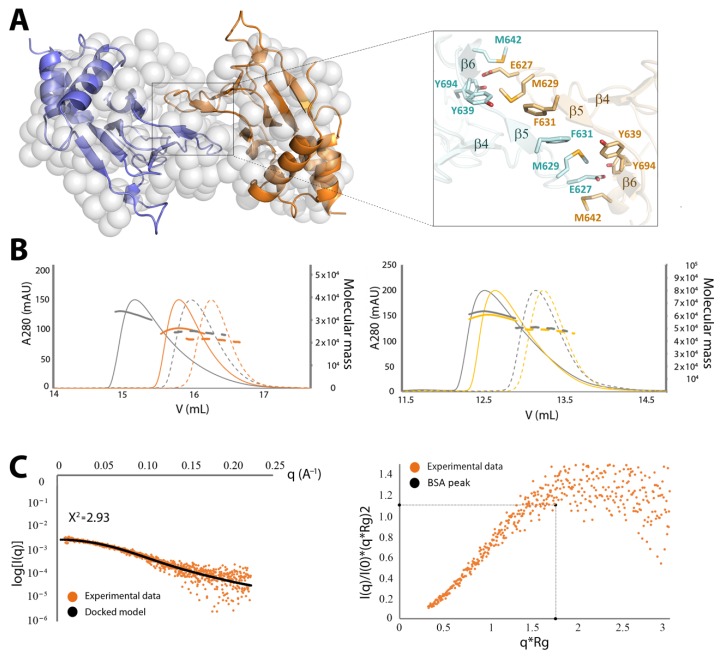
Figure 4.
Structure of the CNNM4cNMP dimer. (A) (left) Association of two CNNM4cNMP domains (blue and orange) in the crystal. The presence of such dimers in solution was confirmed by SAXS data that indicate a shape and volume consistent with the shown bead model (grey spheres). (A) (right) Residues (mostly hydrophobic) at the dimerization interface between CNNM4cNMP subunits, formed primarily by their strands β4 and β5. (B) SEC-MALS analysis of CNNM4cNMP (left) and CNNM4BAT-cNMP-Ctail (right). CNNM4cNMP (grey; Mw = 20936.78 Da monomer) yields an apparent Mw of 24,740 ± 60 Da and 33,920 ± 50 Da at concentrations of 1 mg/mL (dotted lines) and 10 mg/mL (solid lines), respectively, indicating prevalence of the dimer at higher concentration. For the F631A mutant (orange), smaller apparent MW of 21,730 ± 50 Da and 26,440 ± 50 Da are observed for 1 and 10 mg/mL, respectively, indicating that this mutation strongly impedes dimerization. CNNM4BAT-cNMP-Ctail (grey; MW = 47,861.17 Da monomer) similarly yields an apparent Mw of 51,120 ± 60 Da and 63,610 ± 100 Da for 1 and 10 mg/mL, respectively, again indicating prevalence of the dimer at higher concentration. For its F631A mutant (yellow), very similar MW of 49,230 ± 80 Da and 60,920 ± 90 Da are derived, indicating a negligible effect on CNNM4BAT-cNMP-Ctail dimerization. Thus, the disruption of CNNM4cNMP dimerization by this mutation (see left) is overridden by dimerization via the still intact Bateman module. (C) SAXS analysis of CNNM4cNMP. (left) Experimental SAXS data (orange) and scatter curve (black) for the best-fit bead model (Χ2 = 2.93) of CNNM4cNMP dimers in solution (shown in (A)). (right) The dimensionless Kratky plot (orange) indicates a well-folded, flexible, and elongated arrangement for CNNM4cNMP. The corresponding BSA reference peak is also shown.

