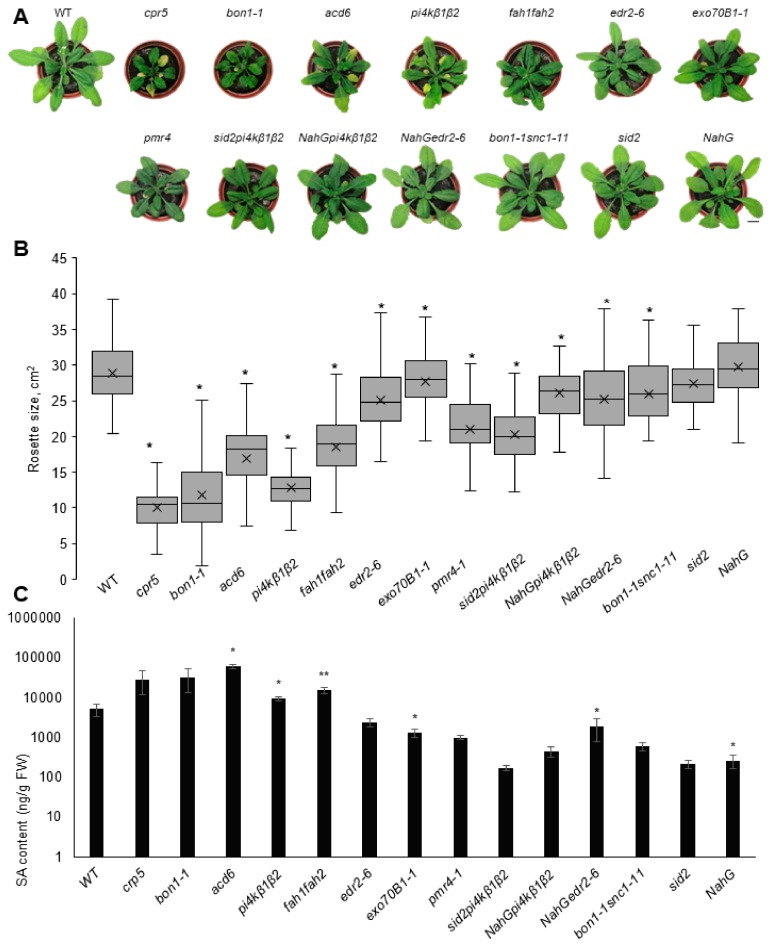
Figure 1.
Rosette size and SA content of plants cultivated under long-day conditions. (A) Representative images of 4 week old plants cultivated at 22 °C, 16 h light/ 8 h dark. (B) Rosette size (area). Data are from three biological replicates, n ≥ 70. Central line of the boxplot represents the median occupancy, cross represents the mean, bottom and top edges of the box are 25 and 75% of distribution and the ends of whiskers are set at 1.5 times the interquartile range. (C) SA content in the leaves, n = 4. Data represent means + SEM, asterisks indicate variants different from WT, one-way ANOVA with Tukey’s HSD post hoc test, * p < 0.05, ** p < 0.01.

