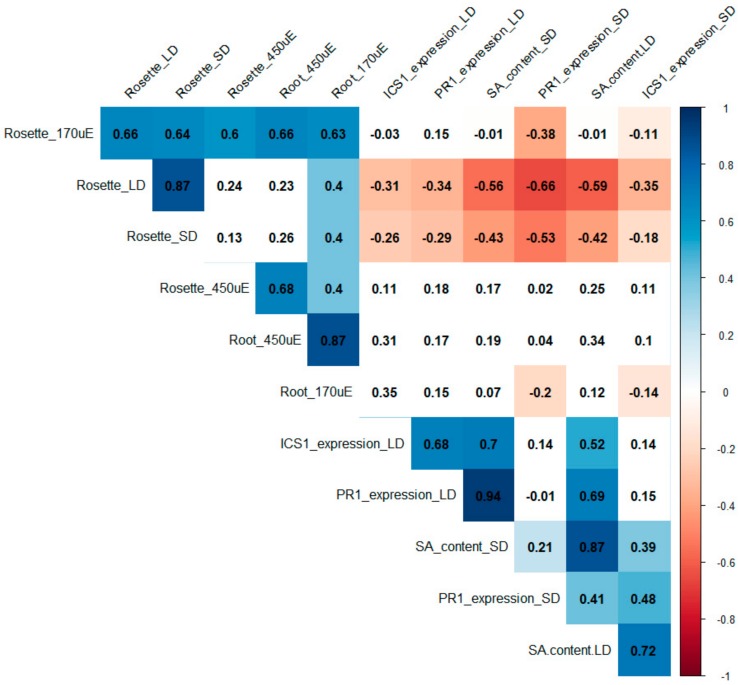
Figure 4.
Correlation table of SA effects on growth. The matrix was built using the Pearson correlation for 12 parameters (rosette size, SA content and SA-related gene expression (ICS1 and PR1) for soil-grown plants under short-day (SD) and long-day (LD) conditions; and rosette weight and primary root length for in vitro grown plants grown under an LD photoperiod at 450 uE or 170 uE light intensity). Measurements were taken for 15 genotypes (listed in Table 1). Data are from three biological repetitions for each variant. Positive correlations are displayed in blue and negative correlations in red. Correlation coefficients are indicated. Only results that passed the 0.05 threshold for significance are displayed in colour.

