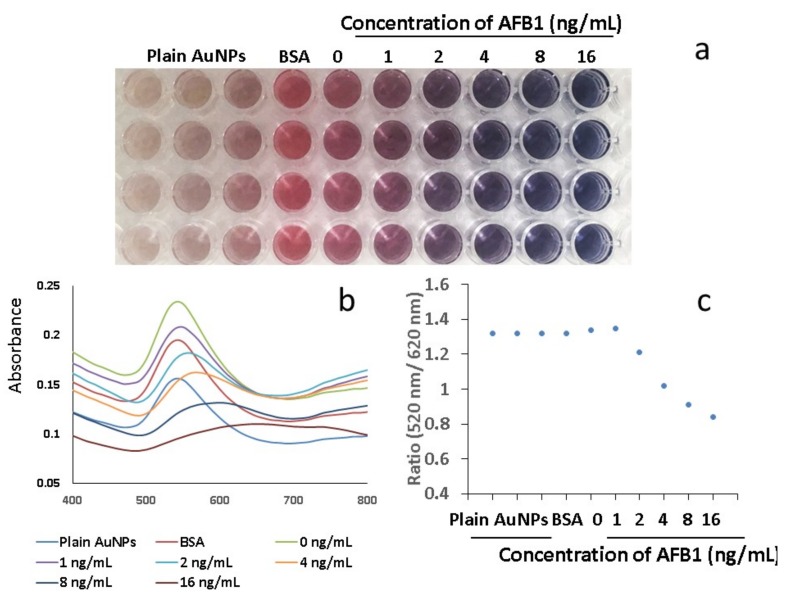
Figure 4.
Surface plasmon resonance (SPR) of conjugated AuNPs reacted with antigen in 96-well plate (n = 4). (a) The different concentrations of AFB1 against conjugate AuNPs in 96-well plate. The wells 1–3 show plain AuNPs, and well 4 shows conjugated AuNPs without BSA. The concentration of AFB1 increases from well 5 to well 11 (from left to right) with a concentration of 0, 1, 2, 4, 8, and 16 ng/mL respectively. The wells from first row to fourth row are replicates. The conjugated AuNPs with BSA appear light pink (well 4). The conjugated AuNPs without antigen show red (well 5). The conjugated AuNPs mixed with antigen at concentration of 1 ng/mL show pink/purple (well 6). The conjugated AuNPs show purple colour when the concentration of antigen increases to 2 ng/mL. (b) Spectra of the conjugated AuNPs react with antigen. (c) Ratio of nanoparticle spectra absorbance at 520 nm/620 nm. The absorbance ratio 520 nm/620 nm gradually increases after the conjugated AuNPs are mixed with antigen. The ratio 520 nm/620 nm decreases when it reaches 0.8. The ratio of absorbance exhibits a plateau below 0–1 ng/mL and above 2 ng/mL, which defines the limits of detectability, and an approximately linear region in between 2 ng/mL to 16 ng/mL.

