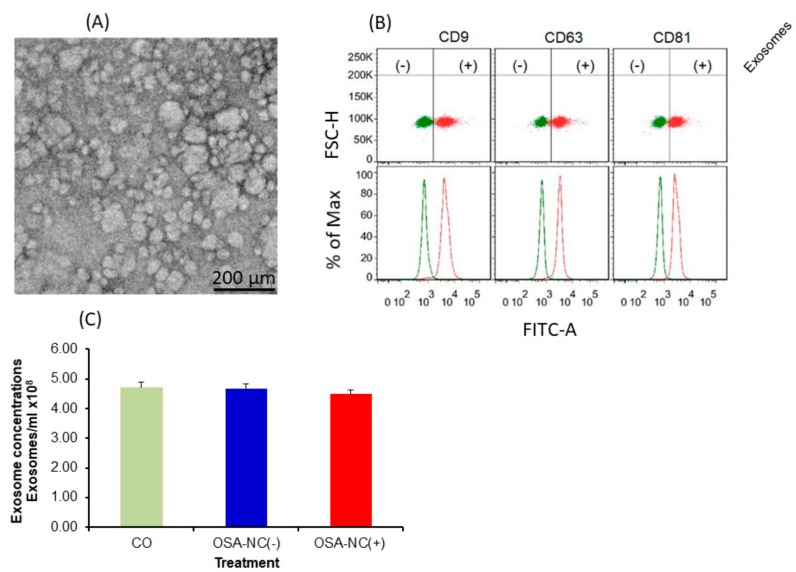
Figure 2.
EVs characterization and quantification. Plasma EVs size distribution was determined using electron microscopy. EVs were also characterized using flow cytometry, and quantified using a commercial kit. Panel (A) shows the size distribution of EVs. Panel (B) shows flow cytometry analysis of purified plasma EVs following specific isolation with magnetic beads stained with anti-CD9, CD63, and CD81. Panel (C) The Exo-Flow magnetic stand for EVs separation and FACS analysis shows the presence of EVs (positive, blue color) and absence of EVs (negative, red color); beads are displayed on the FACS plot (n = 6).

