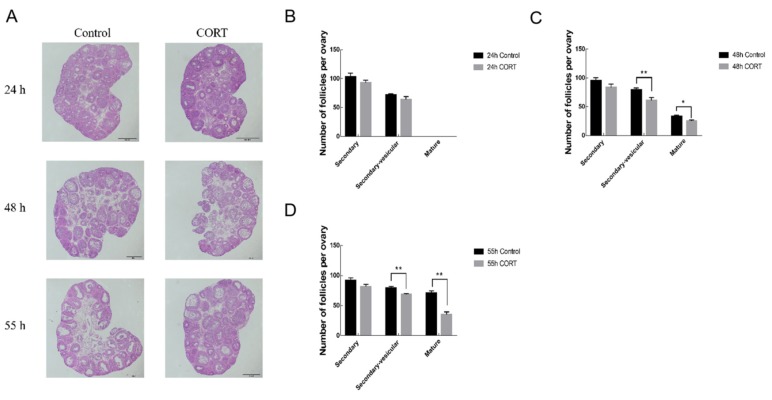
Figure 3.
Influence of CORT on the development of mouse follicles. (A) Ovarian morphology of control group and CORT group at 24 h, 48 h, 55 h; quantitative statistics of secondary follicles, secondary follicles and mature follicles at (B–D) 24 h, 48 h, 55 h. Data are shown as mean ± S.E.; n = 10 in each group. * p < 0.05; ** p < 0.01.

