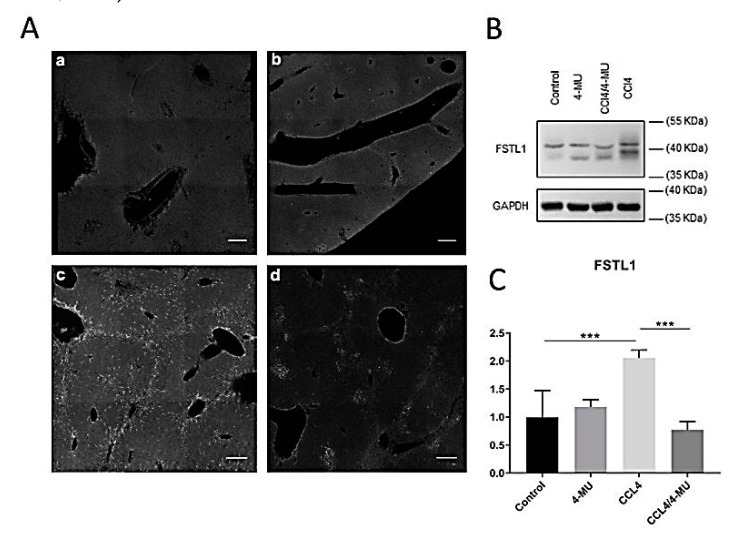
Figure 7.
Evaluation of 4MU effects on Fstl-1 protein level during CCl4 induced fibrosis. (A) Immunohistochemical characterization of Fstl-1 in two weeks liver samples: a—control group, b— 4MU-treated group, c—CCl4-treated group, d—CCL4/4MU treated group, scale bar: 100 um. (B) Western-blot analysis for FSTL-1 at a two-week time point. (C) Quantification Fstl-1 immunopositive bands, normalized on the glyceraldehyde 3-phosphate dehydrogenase (GAPDH) level. Data represented as mean ± SD *** p < 0.001.

