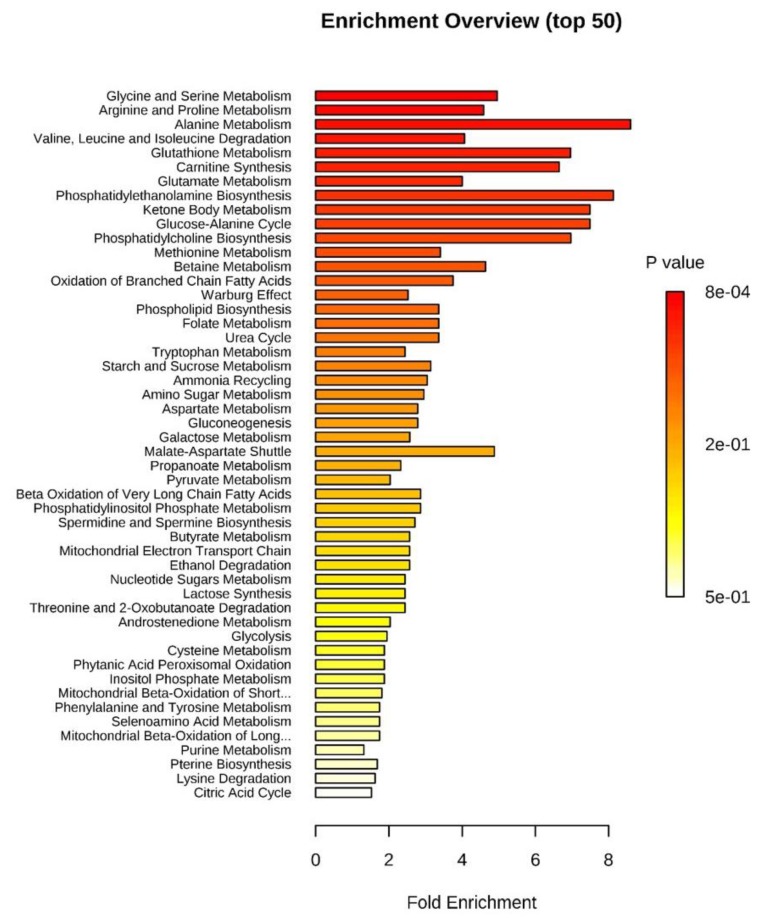
Figure 4.
Graphical overview of the over representation analysis (ORA) for all metabolites identified in bovine oEVs generated by MetaboAnalyst 4.0 web-based software. Pathway associated metabolite sets are sorted based on fold enrichment and p value. Further details on p-values and metabolites included in each pathway are detailed in Table 4.

