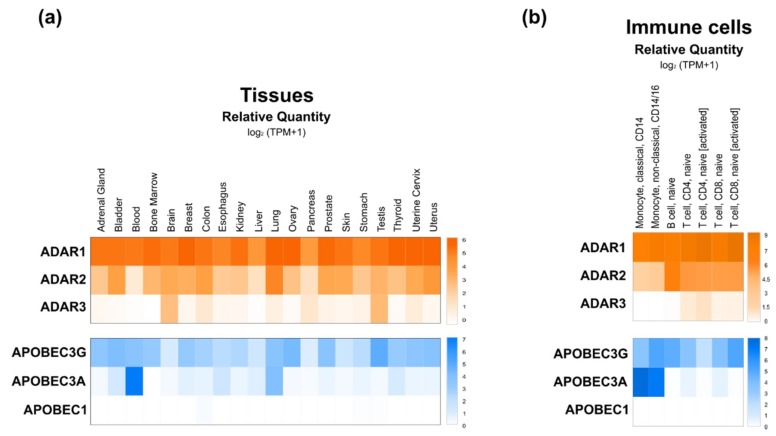
Figure 2.
Expression patterns of ADAR and APOBEC editing enzymes. (a) Heat map showing mean relative expression (log2(transcripts per million (TPM) + 1)) of ADARs and APOBECs across different tissues. Expression levels of each gene were retrieved using GEPIA2 database (http://gepia2.cancer-pku.cn/#index), which include non-tumoral tissue samples from the Cancer Genome Atlas (TCGA) and normal tissue samples from the genotype-tissue expression (GTEx) projects. (b) Heat map showing mean relative expressions (log2 TPM + 1) of ADARs and APOBECs in subpopulations of immune cells, before or after activation. Expression levels of each gene were retrieved from DICE database (https://dice-database.org/). Both heat maps were designed using Morpheus (https://software.broadinstitute.org/morpheus).

