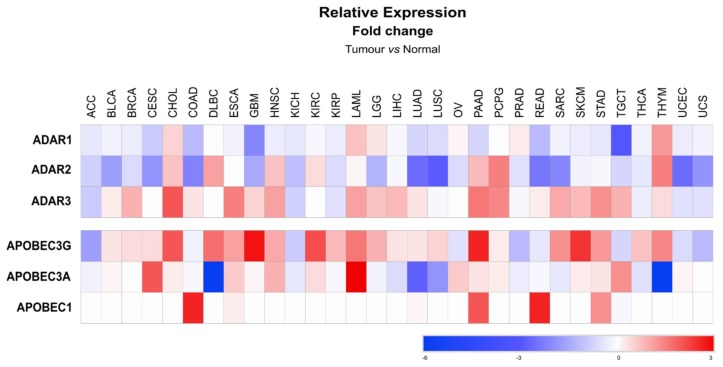
Figure 5.
Expression patterns of ADAR and APOBEC editing enzymes in tumors. The heat map displays the mean fold change, following a log2 transformation, of ADAR and APOBEC gene expression in tumors from different tissues compared to their related non-tumoral tissues. Expression levels of each gene were retrieved using GEPIA2 database (http://gepia2.cancer-pku.cn/#index), which includes non-tumoral tissue and tumor samples from the Cancer Genome Atlas (TCGA). Fold changes were calculated using the ratio of tumor versus non-tumoral expression levels. Heat map was designed using Morpheus (https://software.broadinstitute.org/morpheus). Tumors are identified according with the TCGA nomenclature: ACC—adrenocortical carcinoma; BLCA—bladder urothelial carcinoma; BRCA—breast invasive carcinoma; CESC—cervical squamous cell carcinoma and endocervical adenocarcinoma; CHOL—cholangiocarcinoma; COAD—colon adenocarcinoma; DLBC—lymphoid neoplasm diffuse large B-cell lymphoma; ESCA—esophageal carcinoma; GBM—glioblastoma multiform; HNSC—head and neck squamous cell carcinoma; KICH—kidney chromophobe; KIRC—kidney renal clear cell carcinoma; KIRP—kidney renal papillary cell carcinoma; LAML – lymphoblastic acute myeloid leukemia; LGG—brain lower grade glioma; LIHC—liver hepatocellular carcinoma; LUAD—lung adenocarcinoma; LUSC—lung squamous cell carcinoma; MESO—mesothelioma; OV—ovarian serous cystadenocarcinoma; PAAD—pancreatic adenocarcinoma; PCPG—pheochromocytoma and paraganglioma; PRAD—prostate adenocarcinoma; READ—rectum adenocarcinoma; SARC—sarcoma; SKCM—skin cutaneous Melanoma; STAD—stomach adenocarcinoma; TGCT—testicular germ cell tumors; THCA—thyroid carcinoma; THYM—thymoma; UCEC—uterine corpus endometrial carcinoma; UCS—uterine carcinosarcoma; UVM—uveal melanoma.

