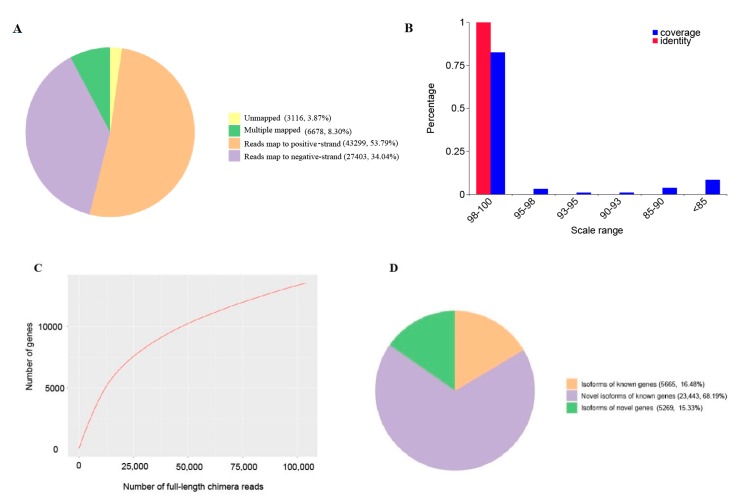
Figure 1.
Results of mapping to reference genome. (A) Pie chart of mapped reads; (B) Range of mapping coverage and identity, x-axis represents the scale ranges, y-axis represents the percentages; (C) Saturation curve of consensus reads, x-axis represents numbers of full-length non-chimera (flnc) reads, y-axis represents numbers of genes; (D) Classification of flnc reads after mapping to the reference genome of G. montanum (= G. luofuense).

