Figure 2.

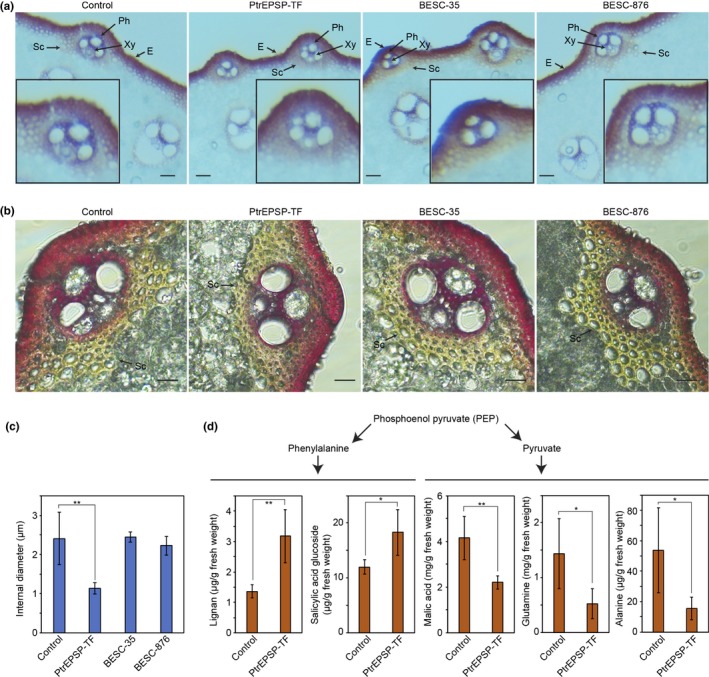
Transgenic rice plants expressing PtrEPSP‐TF display thickened sclerenchyma and altered secondary metabolism. (a) Dissecting microscopy images of phloroglucinol‐HCl stained rice stems from empty‐vector control, archetypic PtrEPSP‐TF, BESC‐35 PtrEPSP‐TF, and BESC‐876 PtrEPSP‐TF. E, Epidermis; Ph, phloem; Sc, sclerenchyma cells; Xy, xylem. Scale bar: 200 µm. (b) Compound microscopy images of phloroglucinol‐HCl stained rice stems empty‐vector control, archetypic PtrEPSP‐TF, BESC‐35 PtrEPSP‐TF, and BESC‐876 PtrEPSP‐TF. Scale bar: 10 µm. Sc, sclerenchyma cells. (c) The Sclerenchyma cells of PtrEPSP‐TF have smaller internal diameter. The internal diameters of ten sclerenchyma cells were measured under a microscope to calculate mean values and standard errors (error bars). P‐value comparison was calculated using two‐tailed Student t tests (**p ≤ .01). (d) Rice plants expressing functional archetypic PtrEPSP‐TF have increased accumulation of phenylpropanoid metabolites, but reduced accumulation of pyruvate metabolites. Four independent replicates were measured to calculate mean values and standard errors (error bars). P‐value comparison was calculated using two‐tailed Student t tests (**p ≤ .01, *p ≤ .05)
