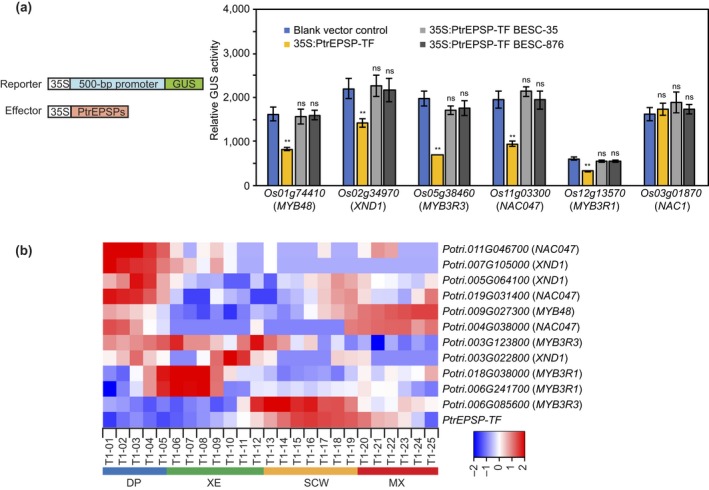
Figure 4.

PtrEPSP‐TF represses the expression of five genes. (a) Left panel: a scheme of reporter and effector constructs used in transactivation assays. Right panel: transactivation assays determining the transcriptional repression of PtrEPSP‐TF on LOC_Os02g34970 (XND1), LOC_Os01g74410 (MYB48), LOC_Os12g13570 (MYB3R1), LOC_Os05g38460 (MYB3R3), and LOC_Os11g03300 (NAC047). All transfection assays were performed in triplicate to calculate the mean value and standard deviation (error bar). P‐value comparison with blank vector control was calculated using two‐tailed Student t tests (**p ≤ .01, *p ≤ .05, ns p > .05). (b) Heatmap of expression levels of PtrEPSP‐TF, Potri.003G022800 (XND1), Potri.005G064100 (XND1), Potri.007G105000 (XND1), Potri.009G027300 (MYB48), Potri.018G038000 (MYB3R1), Potri.006G241700 (MYB3R1), Potri.003G123800 (MYB3R3), Potri.006G085600 (MYB3R3), Potri.011G046700 (NAC047), Potri.004G038000 (NAC047), and Potri.019G031400 (NAC047) in wood‐forming zones (http://aspwood.popgenie.org). DP, differentiating phloem zone; XE, xylem expansion zone; SCW, secondary cell wall deposition zone; MX, mature xylem zone. Color bar at the bottom depicts the relative expression levels
