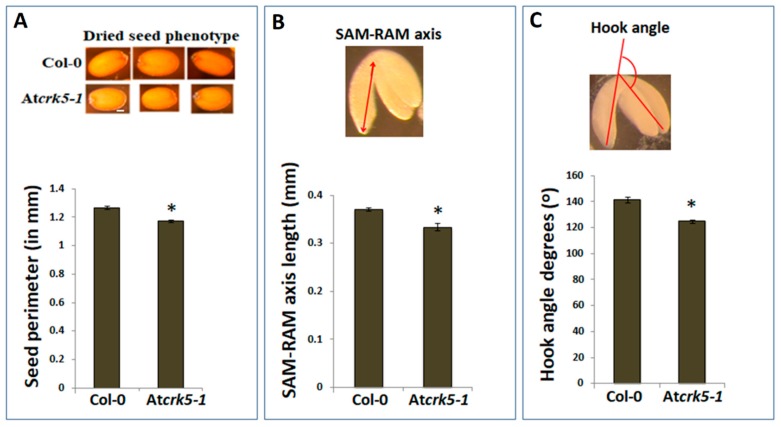
Figure 1.
Differences in seed and embryo sizes and embryo bent-cotyledon hook angles of wild type (Col-0) and mutant (Atcrk5-1) lines. (A) Pictures show dry seeds of the wild type (Col-0) and mutant (Atcrk5-1). The diagram shows the quantification of the seed size in wild type and mutant lines after two days’ imbibition of dried seeds at 4 °C. The seed contours were measured by ImageJ. The averages are from 100 independent seeds from the wild type and mutant, respectively. Standard errors (SE) are also shown. The mutant value indicated by asterisk is significantly lower compared to the wild type (Student’s t-test: p < 0.01, n = 100). (B) Embryo axis length measured from shoot apical meristem (SAM) until root apical meristem (RAM) was calculated in bent-cotyledon-stage embryos arised from the (A) experiment. Pictogram shows how the SAM-RAM axis was measured. All values are averages of at least 100 bent-cotyledon embryos. Standard errors (SE) are also shown. Asterisk depicts significant difference between the wild type and mutant embryos (Student’s t-test: p < 0.05, n = 100). (C) Differences in the hook angles of wild type and mutant embryos at the bent-cotyledon-stage (after two days’ imbibition of seeds at 4 °C). The averages and standard errors (SE) are shown. The mutant value is significantly different in comparison with the wild type (Student’s t-test: * p < 0.01, n = 75). Pictogram shows the mode of measuring embryo hook angles (C). All experiment was repeated three times.

