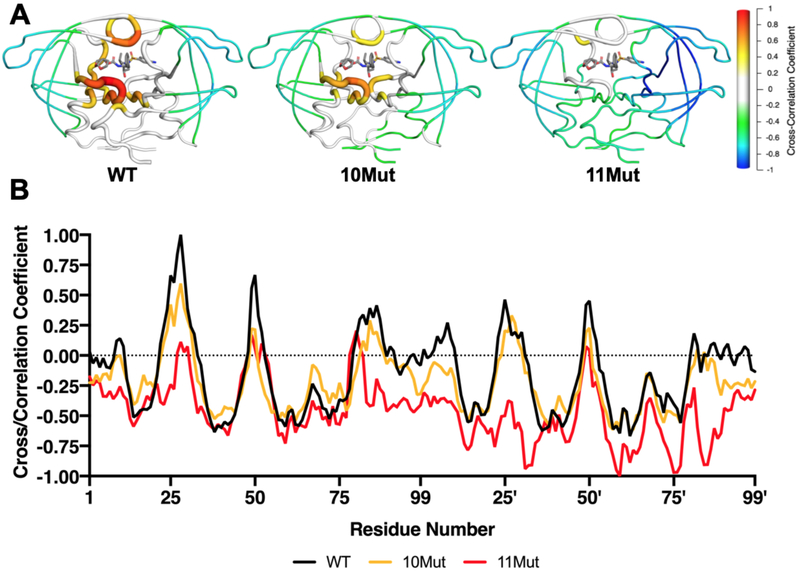
Figure 5.
Cross-correlation of fluctuations between HIV-1 protease and DRV from MD simulations. A) Mean cross-correlation coefficient for each residue mapped onto protease structure, shown as cartoon putty for WT, 10Mut, and 11Mut variants. B) Cross-correlations for WT, 10Mut, and 11Mut plotted. As resistance mutations accumulate, positive correlations decrease while negative correlations increase.

