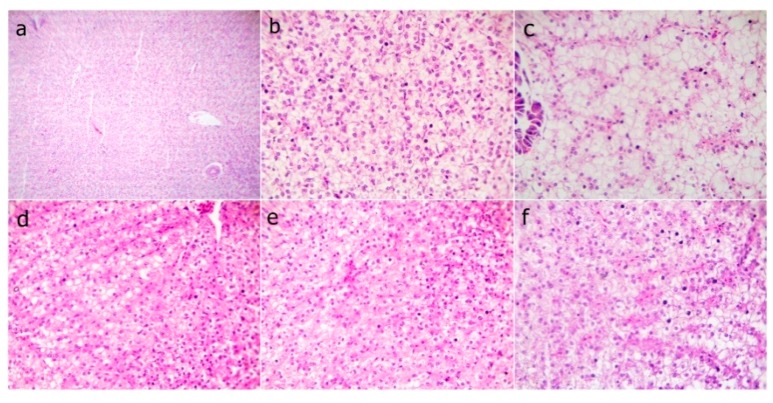
Figure 4.
Representative photomicrograph of H&E stained sections from fish liver before the bacterial challenge showing (a) WPC0—at low 40x and (b) WPC0—high magnification 400x of the normal hepatic structures; (c) WPC13.8—mild fatty hepatocytes at 400x; (d) WPC27.7 and (e) WPC41.6—markedly narrowed sinusoids with slightly congested sinusoids at 400x; (f) WPC55.5—normal hepatocytes and slightly congested sinusoids at 400x.

