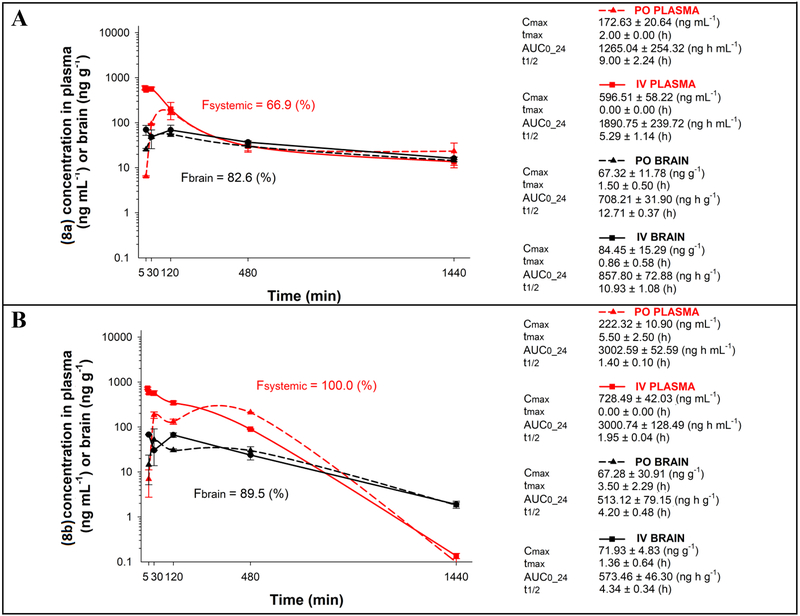
Figure 10:
Pharmacokinetic profiles in plasma and brain following oral gavage (PO) or IV administration of 8a (A) and 8b (B)a
aPlasma and brain absolute bioavailability profiles of 8a (A), and 8b (B) presented in respective graphs as Fsystemic and Fbrain is calculated as a ratio of respective AUC0–24 values obtained after IV and oral gavage (PO) administration of a 2 mg kg−1 dose (n = 3 per time point). Cmax = maximum concentration in brain or plasma; tmax = time of maximum concentration in brain or plasma; t1/2 = terminal elimination half-life; AUC0–24 = area under the concentration versus time curve from zero to last measurable time point.

