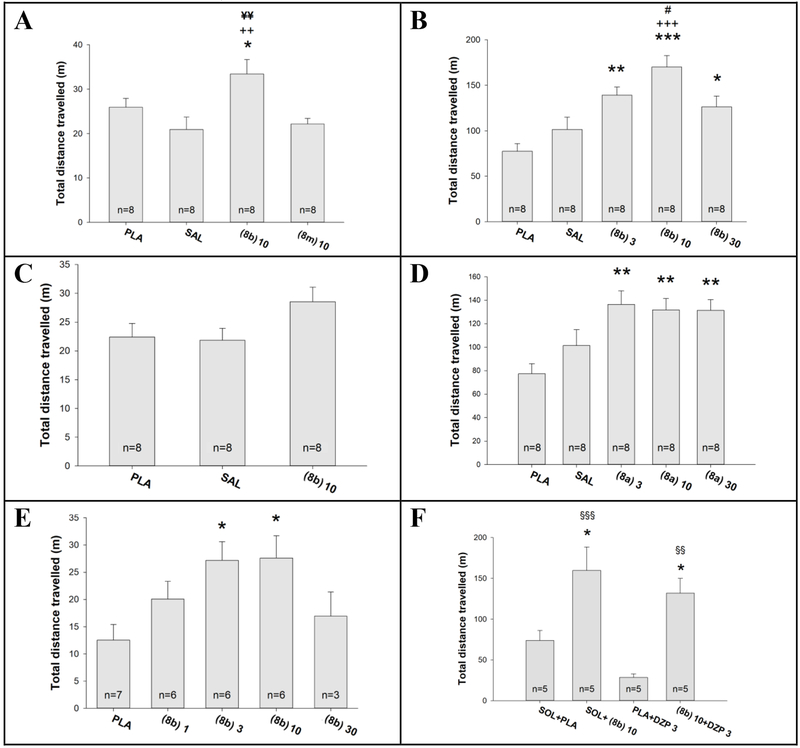
Figure 11:
The measurement of influences on locomotor activity of rats (left panel: A,C,E) or mice (right panels: B,D,F)a
aThe locomotor activity tests were performed in rats (A,C,E) and mice (B,D,F) in six experiments in total. The ligands used were 8a, 8b, 8m and diazepam (DZP), while control groups were placebo nanoemulsion (PLA) and saline (SAL) via IP administration. The number of animals per group is given within columns. The results of ANOVA are as follow: (A) F (3,28)=5.335, p=0.005; (B) F (2,21)=2.542, p=0.103; (C) F (4,23)=3.685, p=0.018; (D) F (4,35)=9.932, p<0.001; (E) F (4,35)=5.745, p<0.001; (F) F (3,16)=10.345, p<0.001. Post hoc significant differences are as follows: *,** and ***, p<0.05, p<0.01, and p<0.001 vs. PLA; ++ and +++, p<0.01 and p<0.001 vs. SAL; #, p<0.05 vs. 8b, 30 mg/kg; ¥¥, p<0.01 vs. 8m, 10 mg/kg; §§ and §§§, p<0.01 and p<0.001 vs. PLA + DZP 3 mg/mg.

