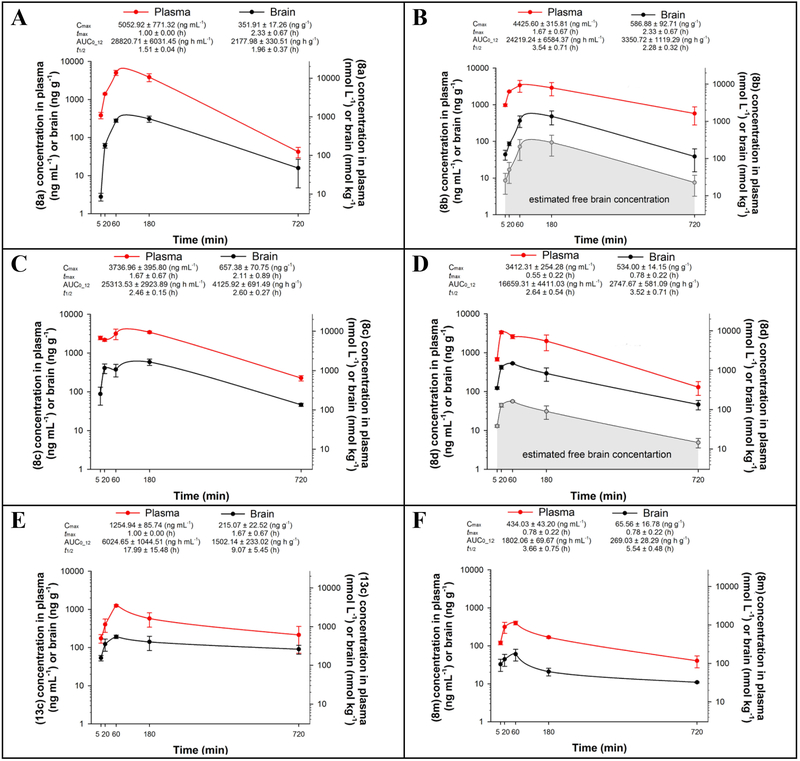
Figure 9:
Pharmacokinetic Profiles of Select Ligandsa
aPlasma and brain concentration–time profiles of 8a (A), 8b (B), 8c (C), 8d (D), 13c (E), and 8m (F) after IP administration of a 10 mg kg−1 dose (n = 3 per time point). Cmax = maximum concentration in brain or plasma; tmax = time of maximum concentration in brain or plasma; t1/2 = terminal elimination half-life; AUC0–12 = area under the concentration versus time curve from zero to last measurable time point.

