
Figure 5.
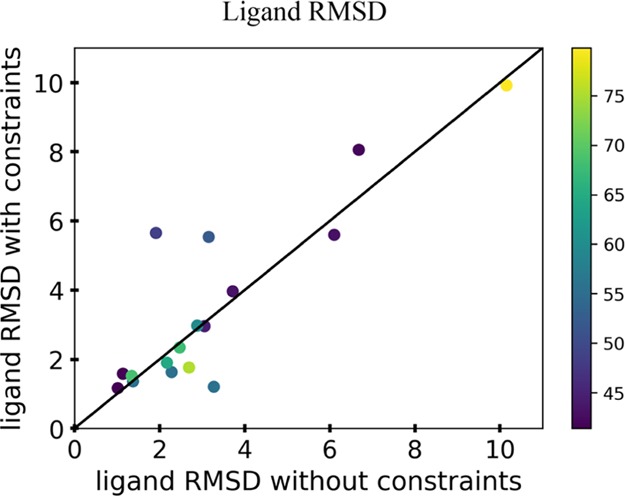
Analysis of the ligand rmsd of the 17 enzymes from the benchmark when docking was performed on the lowest five models with and without the incorporation of the enzymatic constraints. The rmsd was determined by the heavy atoms of the ligand and comparing the target crystal structure ligand to the docked ligand of the models. Each point represents the average rmsd of the lowest five models, and the color of each point in the graphs represents the percent identity of the top template used for modeling.