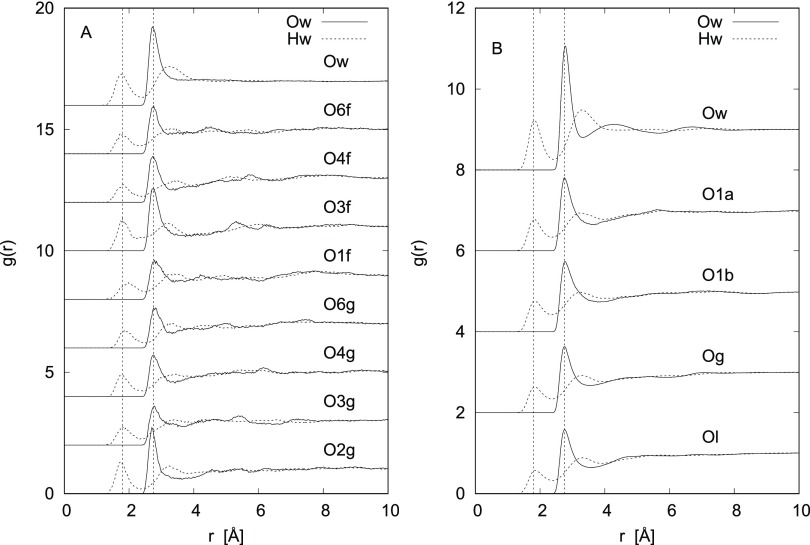
Figure 1.
Hydrogen-bonding interactions for the solutions of natural disaccharides: (A) for sucrose and (B) for lactose. The water–water radial distribution functions for the two samples are reported at the top of the graphic for comparison. The hydrogen–oxygen radial distribution functions are dotted and the oxygen–oxygen ones are solid. Vertical dashed lines at 1.80 and 2.75 Å evidence the position of the first peaks in the Ow–Hw and Ow–Ow correlations, respectively. Labeling is further described in Figures 8 and 9.

