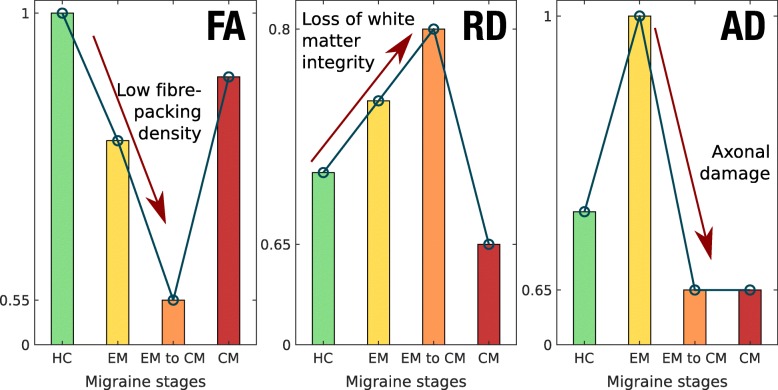
Fig. 3.
DTI measures temporal change hypothesis. Illustrative values are shown for generalized trends in FA, RD and AD (from left to right) in each of the different migraine stages, including a previous healthy control stage. Stages are ordered chronologically from left to right in each subplot. The interpretation of different trends in DTI measures is given in each subplot. The values in the vertical axes should only be used as an orientation to watch the trends and differences between groups, not interpreted as real values

