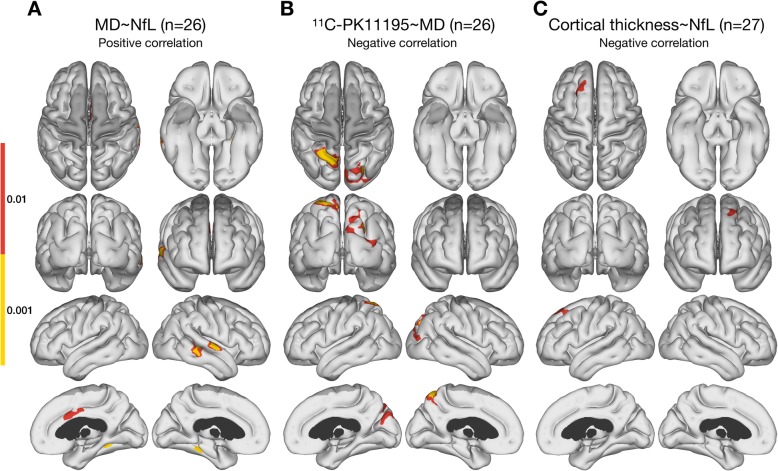
Fig. 2.
Surface based cortical statistics. a Areas with positive correlation between MD and levels of plasma NfL in temporal and cingulate regions. b Areas with negative correlation between MD and 11C-PK11195 BPND in parietal, precuneus, and occipital regions. c Areas with negative correlation between cortical thickness and NfL in frontal region. The presented maps are cluster-level FWER corrected at p < 0.05, with two different cluster-defining primary thresholds: p < 0.01 and p < 0.001. Dark grey indicate areas not covered in all subjects by DWI

