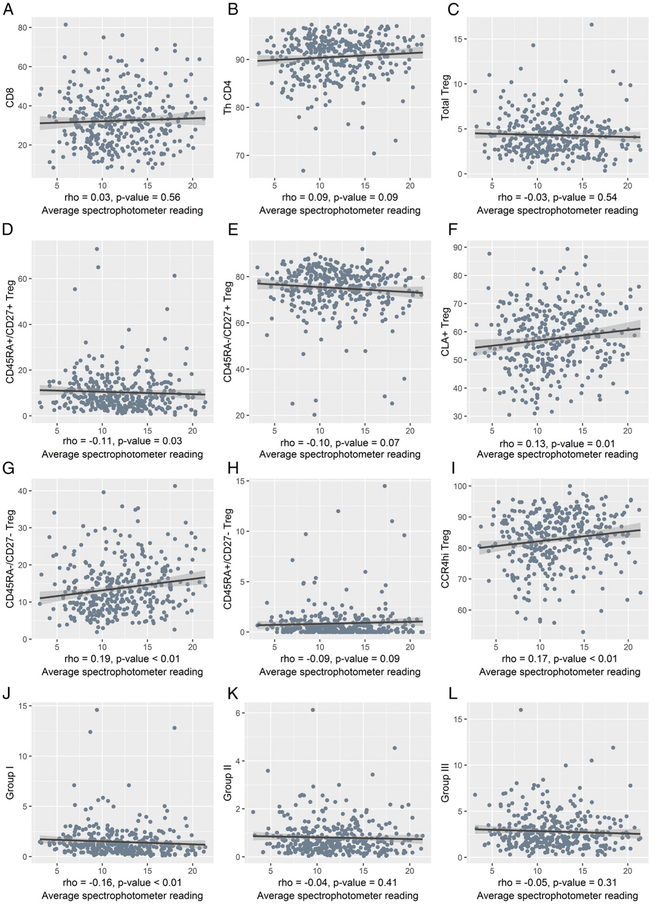
FIGURE 2.
T cell populations in correlation with recent UV exposure among 350 individuals undergoing skin cancer screening. Correlations between Treg cells and UVR were calculated using Spearman rank, and a trend line was created to visualize the associations. (A–C) Scatterplot of spectrophotometer reading and CD8, Th CD4, and total Treg cells. (D–I) Scatterplot of spectrophotometer reading and phenotypes of Treg cells defined in Fig. 1A. (J–L) Scatterplot of spectrophotometer reading and Group I, II, and III Treg cell phenotypes defined in Fig. 1G.

