Fig. 1.
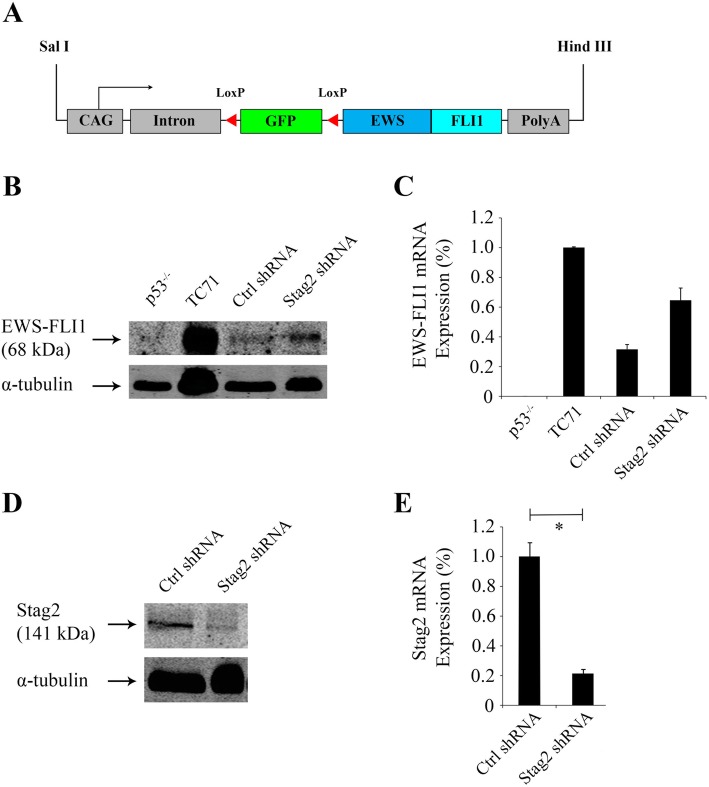
EWS-FLI1 expression and knockdown of Stag2 in MSCs. a Schematic diagram is shown for the EWS-FLI1 transgene. Transcription (arrow) is driven by the CAG synthetic promoter, consisting of the chick β-actin core promoter with the cytomegalovirus immediate early enhancer and rabbit β-globin splice acceptor. LoxP sites flank the green fluorescent protein (GFP) gene. b Western blot with anti-FLI1 antibody shows EWS-FLI1 expression in the Ewing sarcoma cell line TC71 carrying the Type 1 fusion (positive control) but not murine MSCs bearing the p53 null mutation alone without EWS-FLI1 (p53−/−, negative control). Positive expression of EWS-FLI1 was observed in EWS-FLI1 p53−/− MSCs after treatment with random control shRNA (“Ctrl shRNA” cells) and EWS-FLI1 p53−/− MSCs after treatment with Stag2 shRNA (“Stag2 shRNA” cells). Digital scanning of the Western blot showed that the level of protein expression of EWS-FLI1 (band intensity as a percentage of TC71) was 32% in Ctrl shRNA and 65% in Stag2 shRNA cells. c Quantitative RT-PCR, with Rplp0 as the internal reference, confirms mRNA expression of EWS-FLI1 in the same cells. d Stag2 shRNA cells show a decrease in expression of Stag2 compared to Ctrl shRNA cells on Western blot. e Quantitative RT-PCR, with Rplp0 as the internal reference, showed that Stag2 expression was reduced by 78% in Stag2 shRNA cells compared to Ctrl shRNA cells (p < .01)

