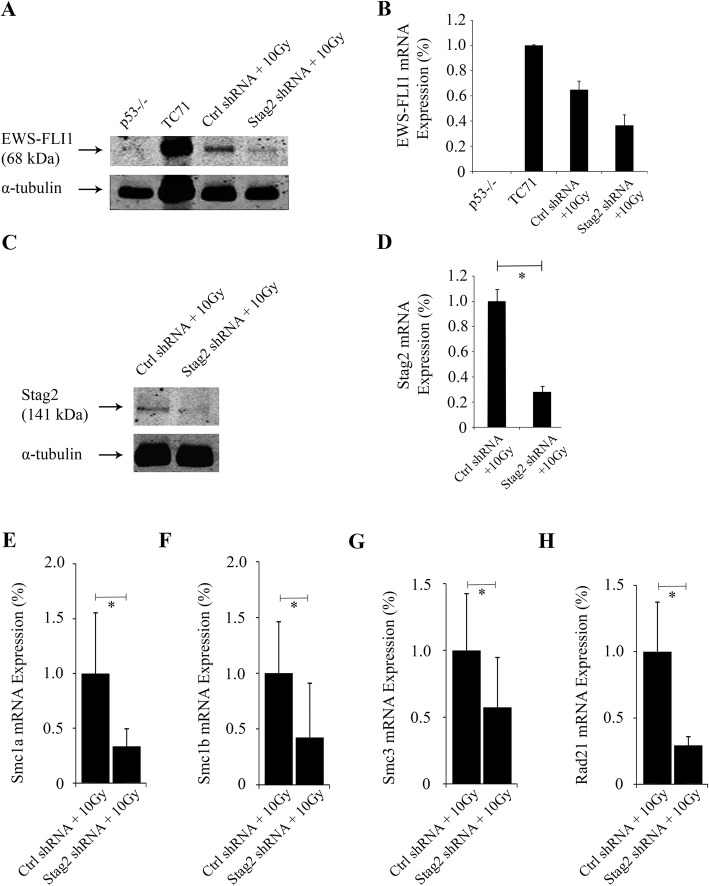
Fig. 3.
Verification of EWS-FLI1 expression and Stag2 knockdown after irradiation of MSCs. a Western blot with anti-FLI1 antibody shows EWS-FLI1 expression in the Ewing sarcoma cell line TC71 (positive control) but not p53−/− cells without EWS-FLI1 (negative control). Both Ctrl shRNA+10Gy and Stag2 shRNA+10Gy irradiated cells showed positive EWS-FLI1 expression. Digital scanning of the Western blot showed that the level of protein expression of EWS-FLI1 (band intensity as a percentage of TC71) was 64.9% in Ctrl shRNA+10Gy and 36.5% in Stag2 shRNA+10Gy cells. b Quantitative RT-PCR, with Rplp0 as the internal reference, confirms mRNA expression of EWS-FLI1 in the same cells. c Western blot for Stag2 shows diminished expression in Stag2 shRNA+10Gy compared to Ctrl shRNA+10Gy cells. d Quantitative RT-PCR, with Rplp0 as the internal reference, showed that Stag2 expression was reduced by 63% in Stag2 shRNA+10Gy compared to Ctrl shRNA+10Gy cells (p < .01). e–h For the genes of the cohesin complex that are coordinately expressed with Stag2, the expression levels of Smc1a e, Smc1b f, Smc3 g, and Rad21 h were reduced by 66, 57, 43, and 71%, respectively, in Stag2 shRNA+10Gy cells compared to Ctrl shRNA+10Gy cells (p < .01). Values were normalized to Rplp0 expression, and the level of gene expression in Ctrl shRNA+10Gy cells was set as the reference baseline

