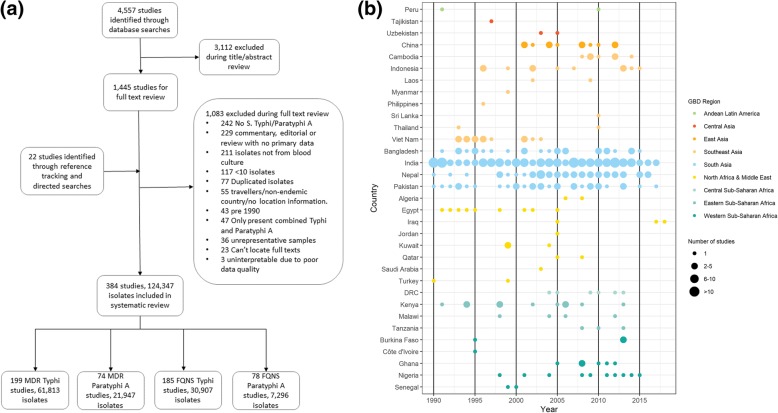
Fig. 1.
Study selection. a PRISMA flow chart depicting study screening and selection; approximately 150 studies were received from the Bodleian Library/British National Library. b Data availability plotted by year (x-axis) and country (y‐axis), grouped by region. The number of studies for each country‐year is depicted by the size of the point

