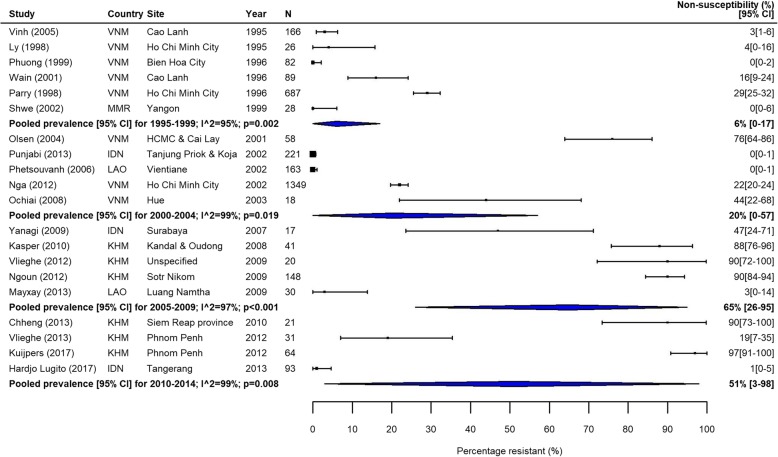
Fig. 5.
FQNS S. Typhi in Southeast Asia. Forest plots illustrating the prevalence of FQNS amongst S. Typhi in South Asia, grouped by 5‐year time periods. Individual study results are displayed with 95% confidence intervals; the pooled prevalence [95%CI] for each subgroup is represented by the blue diamonds

