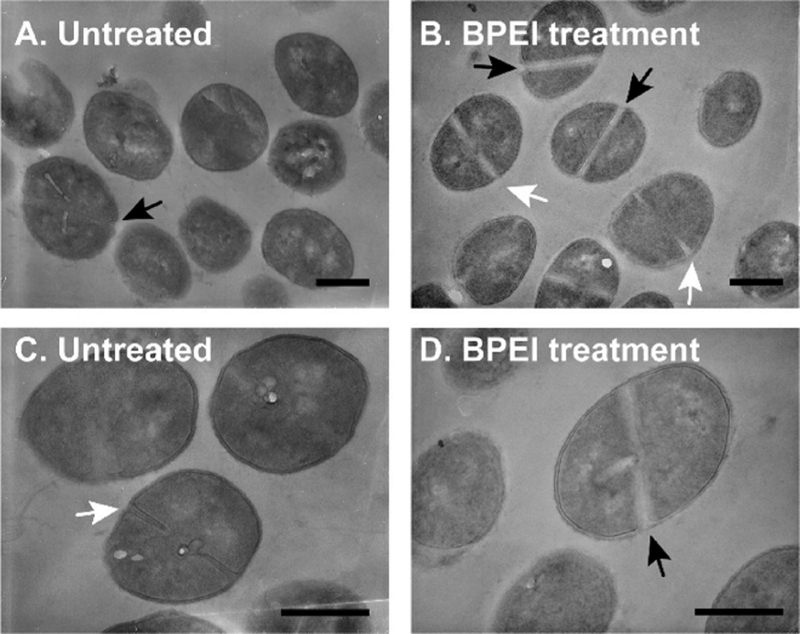
Figure 5.
TEM images of MRSA USA300 cells do not show drastic changes in division septa. Cells treated with (B and D) BPEI have thicker division septa in comparison to (A and C) those of the untreated cells. Black arrows indicate complete septa formation. White arrows indicate incomplete septa formation. The scale bar is 500 nm.

