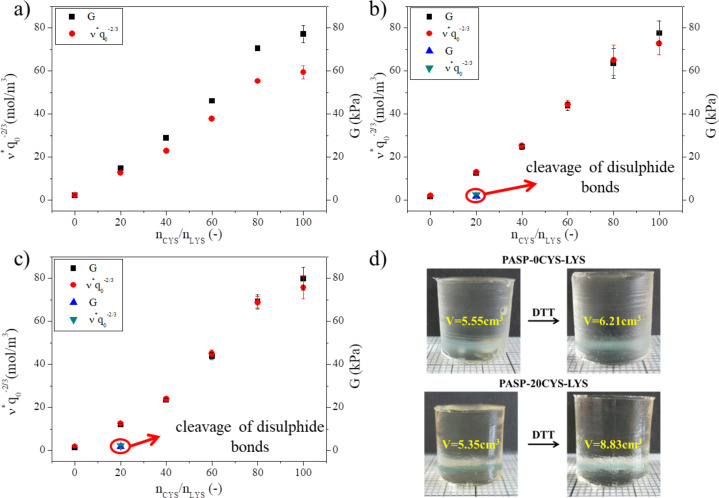
Figure 5.
Dependence of the elastic modulus G (black squares, blue triangles) and the concentration of the elastically active chains v*q0−2/3 (red dots, green triangles) on the CYS/LYS molar ratio in a) DMSO, b) imidazole buffer (pH 8, c = 0.1 M, I = 0.25 M) and c) PBS (pH 7.4, I = 0.15 M). d) Gel cylinders before and after DTT treatment.

