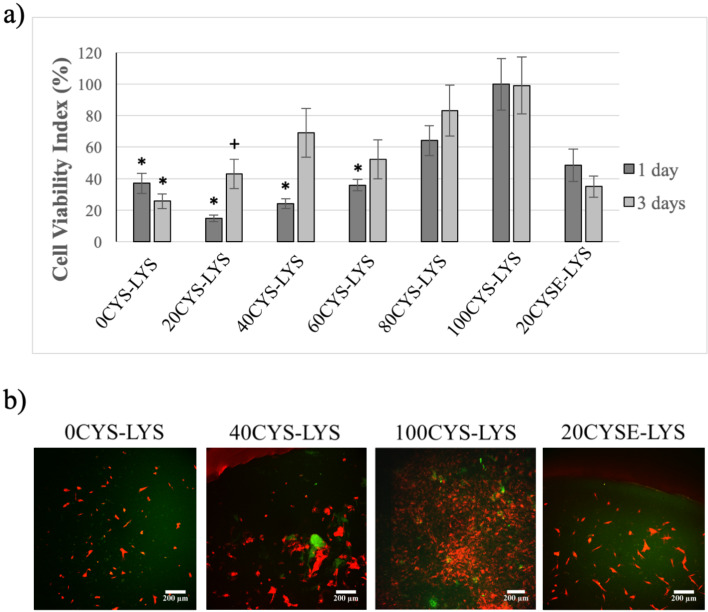
Figure 6.
a) Viability of the PDLCs measured one and three days after seeding. The average viability value measured on the 100CYS-LYS gel on day one was considered as 100%. The cell viability indices are given as arithmetic mean ± SEM. * indicates p < 0.05 compared to the value of 100CYS-LYS at the corresponding time. + indicates p < 0.05 compared to the value of 100CYS-LYS on day one. b) Two-photon microscopic images of the PDLCs on the different hydrogels after three days. The scale bar indicates 200 μm. Each photomicrograph was taken at the same magnification.

