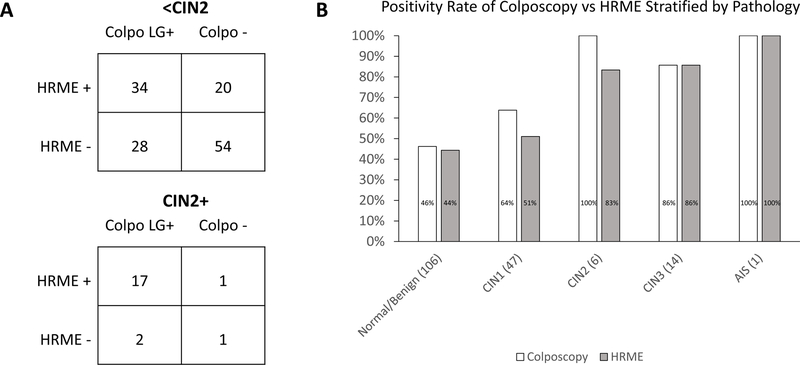
Figure 3:
Graphs Comparing the Positivity of Colposcopy vs HRME
Graphs showing the positivity rate for colposcopy and HRME in comparison to the final histopathology result on a per-patient basis. A) 2 x 2 tables showing the correlation of colposcopy and HRME results for patients diagnosed with <CIN2 (above) and CIN2+ (below). B) Bar graph showing positivity rate for colposcopy and HRME stratified by the final histopathology diagnosis for each patient.

