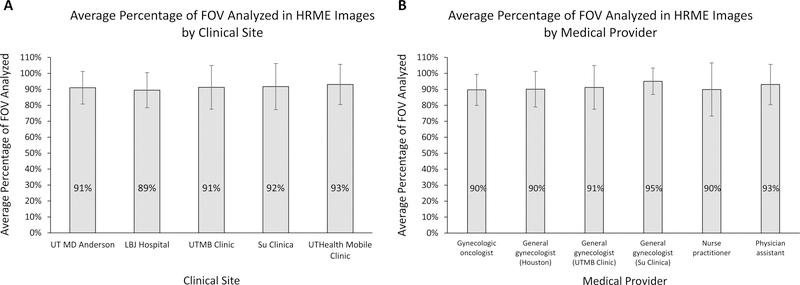
Figure 5:
Graphs of HRME Image Quality
The average percentage of the field-of-view (FOV) included in the automatic analysis of HRME images stratified by A) clinical site and B) medical provider. One-way ANOVA of the results revealed no statistically significant difference in image quality between clinical sites (p = 0.77) or medical providers (p = 0.33). Error bars represent one standard deviation

