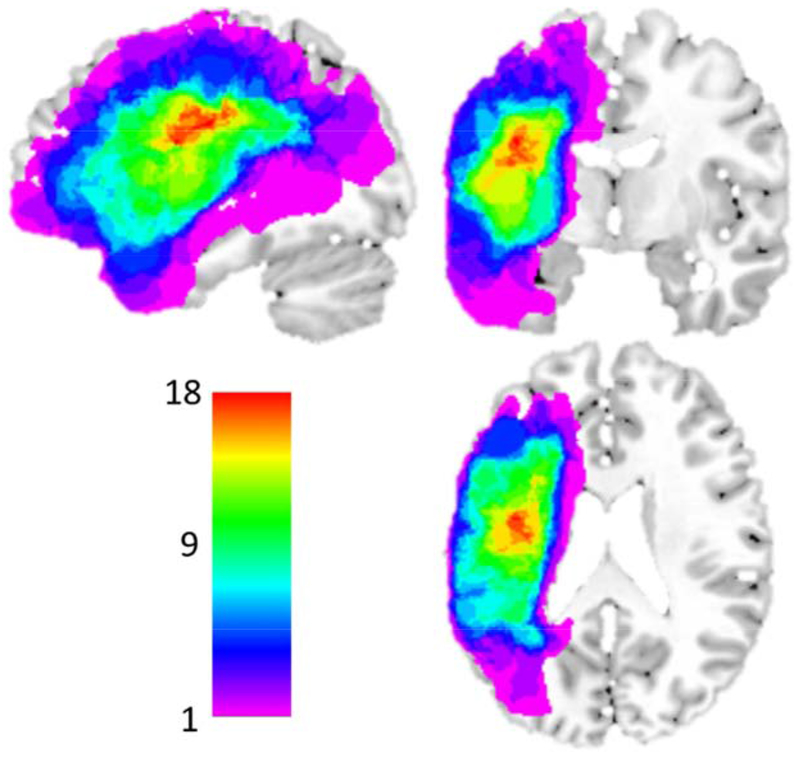
Figure 2: Distribution of MNI normalized lesions in the 21 acquired dysgraphia participants.
Only participants with left hemisphere stroke were included in this study; inclusion based on lesion location was not constrained in any other way. Color scale indicates the number of overlapping lesions at each voxel. The areas of greatest lesion overlap include left posterior frontal, insula, anterior parietal and superior temporal regions. Note that the left ventral occipitotemporal cortex was mostly intact in this sample.

