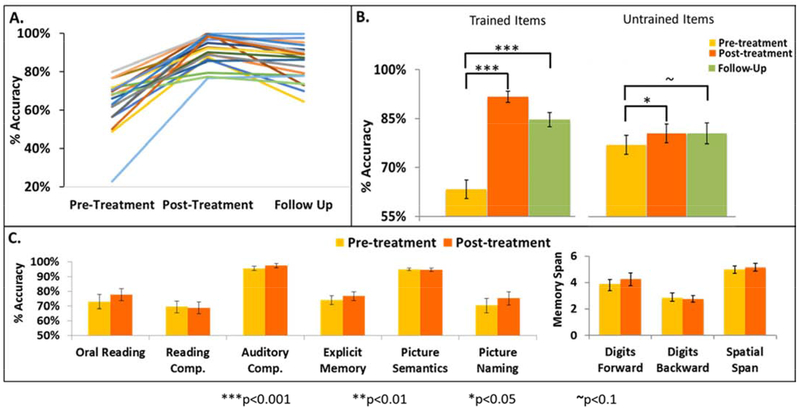
Figure 3: Scores on spelling and other language and cognitive tests.
A. Raw score percent Accuracy on Training Items at Pre-Treatment, Post-Treatment, and Follow-Up. Each color depicts an individual participant. B. Average percent spelling accuracy at Pre-Treatment, Post-Treatment, and Follow-Up for the Training Items on the left and Untrained Items on the right. C. Performance at Pre- and Post-Treatment for tests not associated with spelling; see Supplemental Materials Sections S1 for task details. For B and C, the error bars are standard error of means; corrected thresholds *** p< 0.001; *p< 0.05; ~ p <= 0.1

