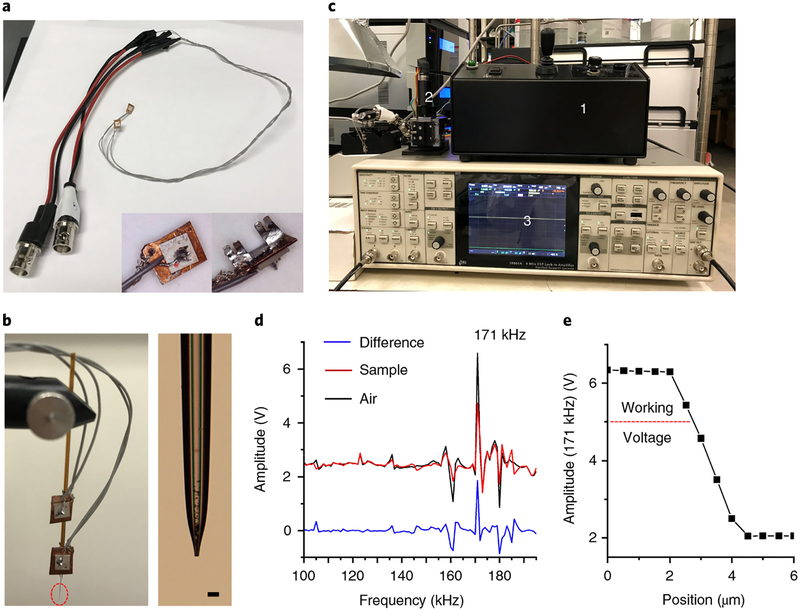
Fig. 3 |. Shear force microscopy.
a, Photo of piezoelectric ceramic plates with cables. The back and front views of the piezo plate are shown in bottom right corner. b, Setup of the shear force probe. Left, the upper plate is used to induce the probe oscillation that connects to the sine out (+) of the lock-in amplifier (i.e., the internal oscillator). The lower plate is used to detect the amplitude of the probe vibration that connects to the A input of the amplifier. Right, the zoomed-in view of the probe tip, corresponding to the red dashed circle in the left panel. Scale bar, 25 μm. c, Photo of the main components for performing shear force microscopy, highlighting (1) a stepping controller for the motorized micro-positioner; (2) a motorized micro-positioner assembled with a shear force probe; (3) a lock-in amplifier. d, Excitation spectra acquired with the probe kept in air (air, black trace) and positioned on the tissue surface (sample, red trace). Blue trace (difference) represents the difference spectrum between the air and the tissue surface. e, An approach curve at 171 kHz is established by plotting the amplitude of the shear force probe vibration as a function of the distance between the sample and the probe.

