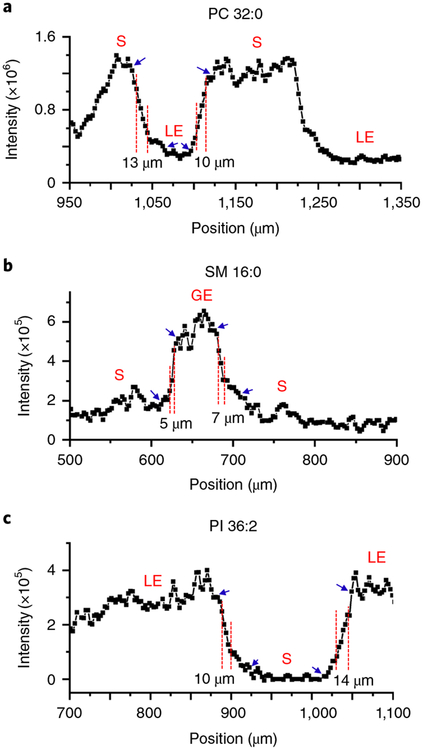
Fig. 6 |. Representative line profiles of PC 32:0, SM 16:0, and PI 36:2 acquired on uterine tissue.
a, Chemical gradients for PC 32:0 are observed on the boundaries between S and LE cells. b, Chemical gradients for SM 16:0 are observed on the boundaries between S and GE cells. c, Chemical gradients for PI 36:2 are observed on the boundaries between S and LE cells. The spatial resolution of our approach ranges from 5 to 14 μm, estimated as the distance over which the signal intensity increases from 20 to 80% of the maximum value (labeled with red dashed lines). Blue arrows present the maximum (100%) and minimum (0%) values.

