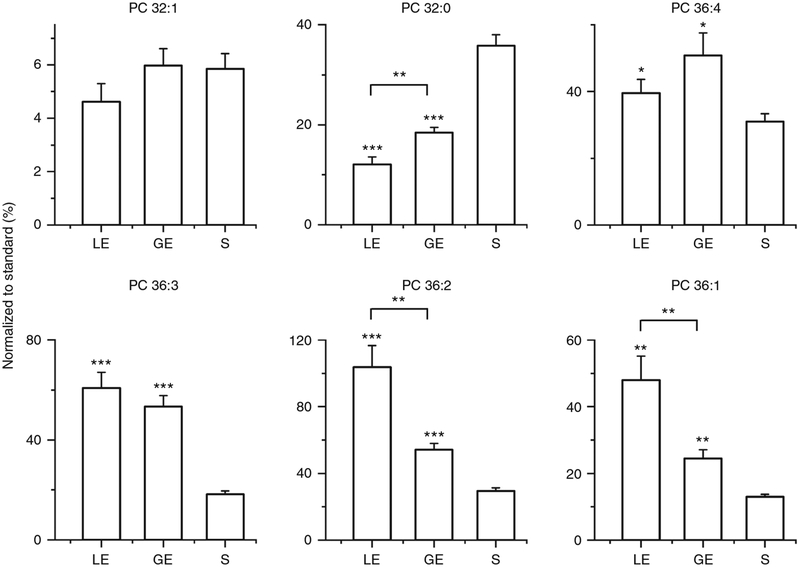
Fig. 7 |. Quantitative analysis of endogenous PC species in different types of uterine cells.
y axis presents the normalized intensities of PC species to LPC 19:0. t-test analysis was performed for LE versus S cells and GE versus S cells, and the resulting P values are shown above the corresponding bars; *P < 0.05, **P < 0.01, ***P < 0.001. For PC 32:0, PC36:2 and PC 36:1, t-test analysis was also performed for LE versus GE cells; the resulting P values are displayed using square brackets.

