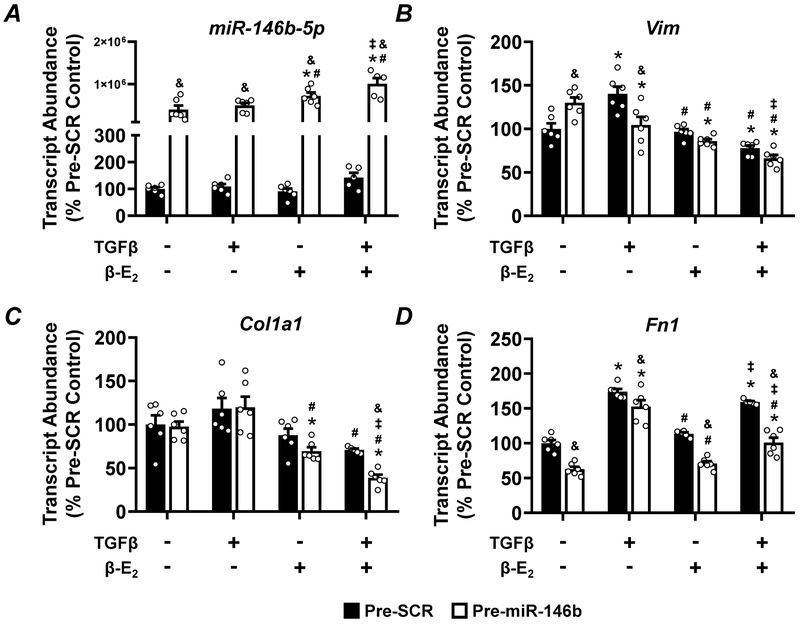
Figure 11: Pre-miR-146b treatment of NRK-49F cells may blunt expression of pro-fibrotic markers.
qRT-PCR analysis of (A) miR-146b-5p abundance, (B) the mesenchymal marker Vim and the pro-fibrotic markers (C) Col1a1, and (D) Fn1 from NRK-49F cells treated with pre-miR-146b. All data presented as mean ± SEM, n = 6/group; * p<0.05 vs. control within group; # p<0.05 vs. TGF-β only, within group; ‡ p<0.05 vs. β-E2 only, within group; & p<0.05 pre-miR-146b vs. anti-SCR between indicated groups.

