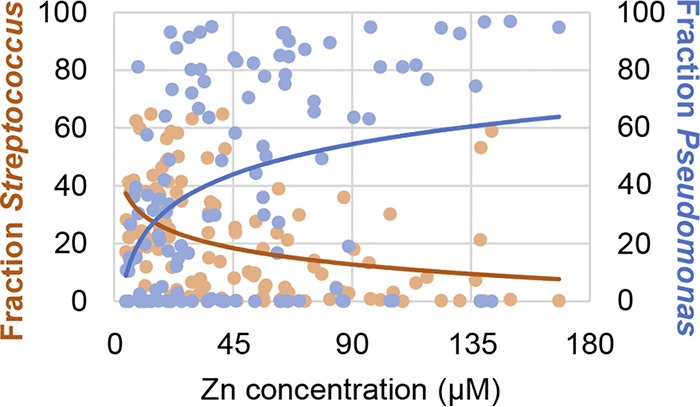
FIG 6.

The relationship between sputum zinc concentration and the relative abundances of Streptococcus and Pseudomonas spp. The relative abundance of Streptococcus (orange dots) and Pseudomonas (blue dots) in each sputum sample (indicated as a fraction of 100% of the total microbial community) is plotted versus the concentration of zinc in the corresponding sample. For each sputum sample, there are two dots, one for Streptococcus and one for Pseudomonas. Total zinc was measured by ICP-MS analysis of nitric acid-dissolved samples and normalized to the volume of the sample.
