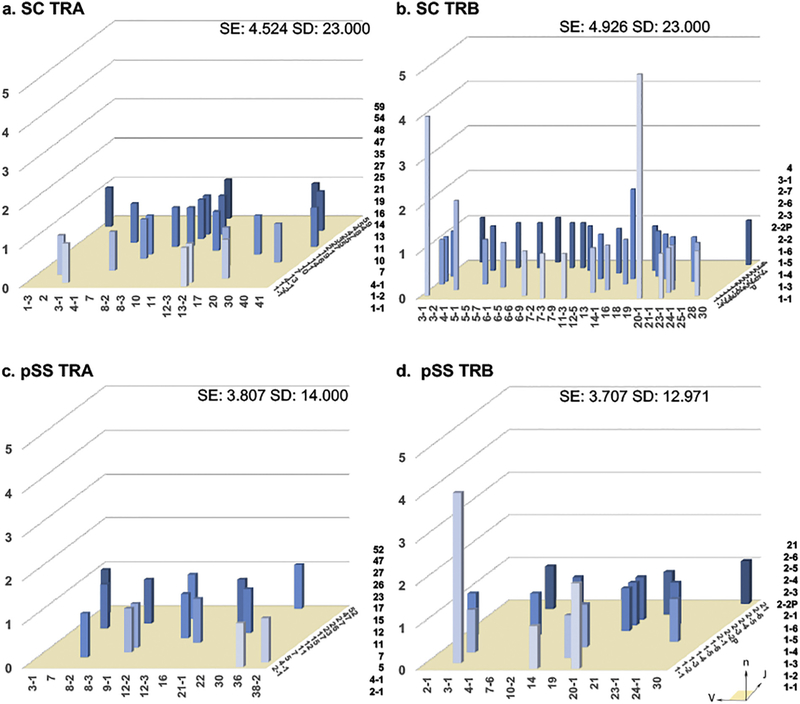
Fig. 2.
Loss of normal distribution in V/J pairing is associated with pSS patients. Total LSG T-lymphocyte three dimensional histograms of TCR gene V/J combinations for SC TRA (a) and SC TRB (b) genes, as well as pSS TRA (c) and TRB (d) genes. The x-axis represents the analyzed Vα or Vβ gene segment, the z-axis is the analyzed Jα or Jβ gene segments, the y-axis indicates the total reads of specific V/J combination. V and J genes were designated by the disambiguated IMGT nomenclature for each gene subgroup. TCR repertoire was quantified by entropy (SE = Shannon’s Entropy) and diversity (SD = Simpson’s Diversity Index).

