
Table 2.
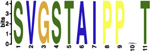
MEME Analysis of high frequency hypervariable regions from SC and pSS patient’s reveal common and unique motifs.
| CDR3 amino acid motif | E-value | Cell Type | V-J |
|---|---|---|---|
 |
1.4e−037 | Various | Vβ3–1/Jβ1–2 |
 |
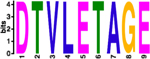
1.1e−021 | Th1 (Th17)* | Vβ20–1/Jβ1–1 |
 |
1.5e−001 | pSS Th1** | Vα30/Jα52 |
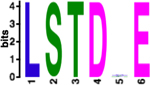 |
4.3e+002 | pSS ** | Vα-Jα Various |
Amino acid motif analysis was performed on the high frequency CDR3 sequences from both SC and pSS patients. Bit height corresponds to the likelihood of the amino acid in each position. Blue – hydrophobic, uncharged amino acids, Red – positively charge hydrophilic amino acids, Green – Neutral hydrophilic amino acids, Magenta – negatively charged hydrophilic amino acids, Orange-glycine, and Yellow—proline. E-value indicates the model confidence for the amino acid in that position. Cell type indicates the phenotype associated with the motif, V/J indicates recombination gene segment pairings.
Indicates a bias towards presence in Th1 cells.
Present in only pSS patients.