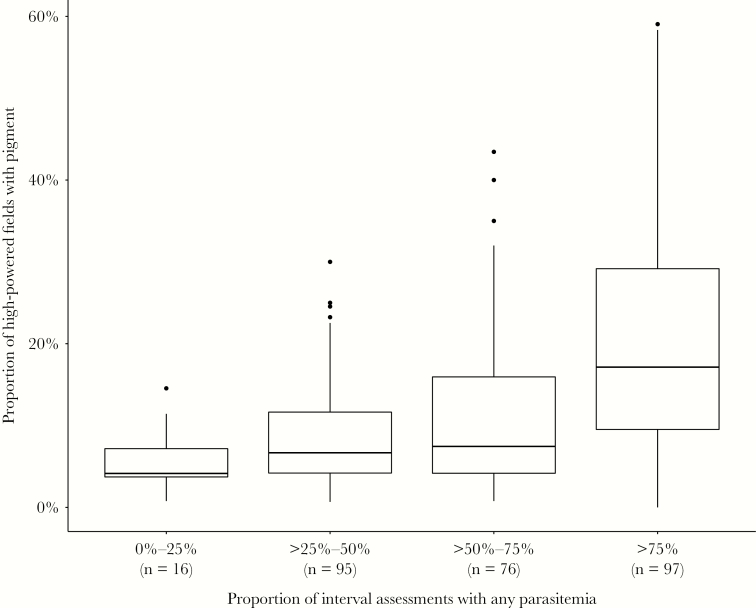
Figure 3.
Proportion of high-powered microscopy fields with pigment by proportion of interval assessments with any parasitemia among those with placental malaria. Numbers at the bottom of each bar represent the total number of patients in the category (n). Boxes represent interquartile range (IQR), with median represented as a horizontal band. Whiskers extend to Q3 + 1.5IQR and Q1 − 1.5IQR.

