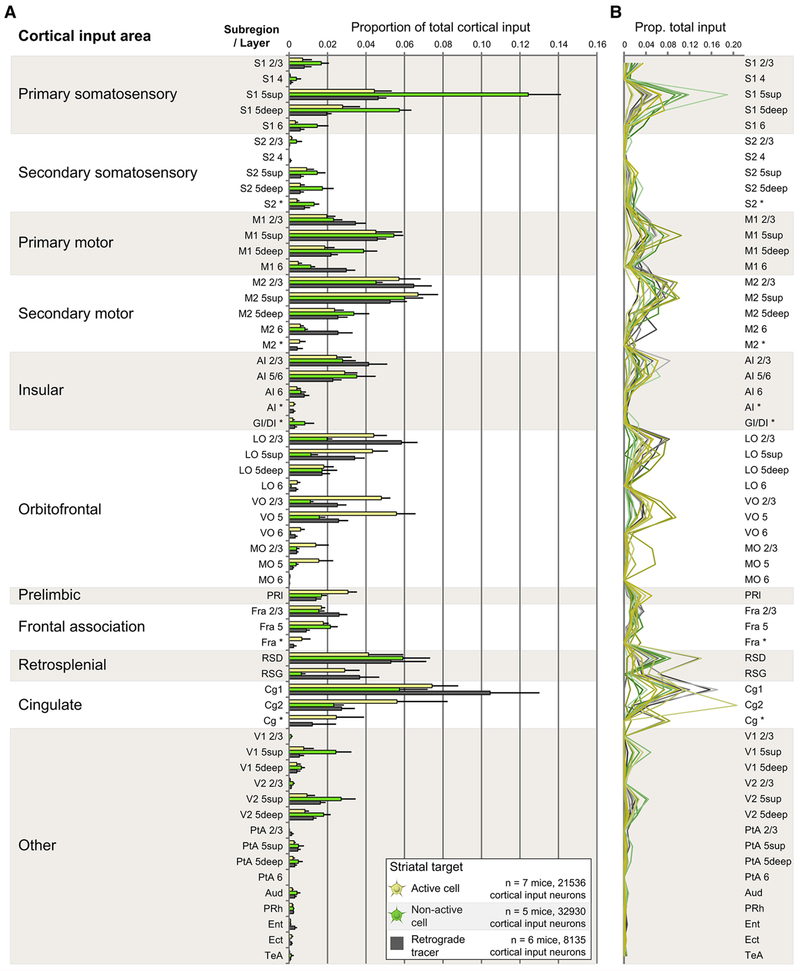
Figure 2. Cocaine-activated and Non-activated Striatal Neurons Receive Monosynaptic Inputs from Similar Sets of Cortical Input Areas.
(A) Origins of ALL cortical projections to cocaine-activated DS neurons (yellow), non-activated cells (green), or to DS nonspecifically (gray). Data are shown as mean ± 1 SEM. Significant interaction effect F(114, 870)=2.836, p < 0.001. Cre-ON different from Cre-OFF AND Retrograde RV in the following regions (p values multiplicity-adjusted via Dunnett’s test): VO 2/3 (ON vs. OFF p < 0.001, ON vs. Retrograde p=0.02), VO 5 (ON vs. OFF p < 0.001, ON vs. Retrograde p=0.001), and Cg2 (ON vs. OFF p < 0.001, ON vs. Retrograde p=0.002). Cortical nomenclature consistent with Paxinos atlas (see STAR*Methods).
(B) As in (A), except rather than displaying population averages, each individual mouse is represented by a colored line.
See also Supplemental Excel File 1.

