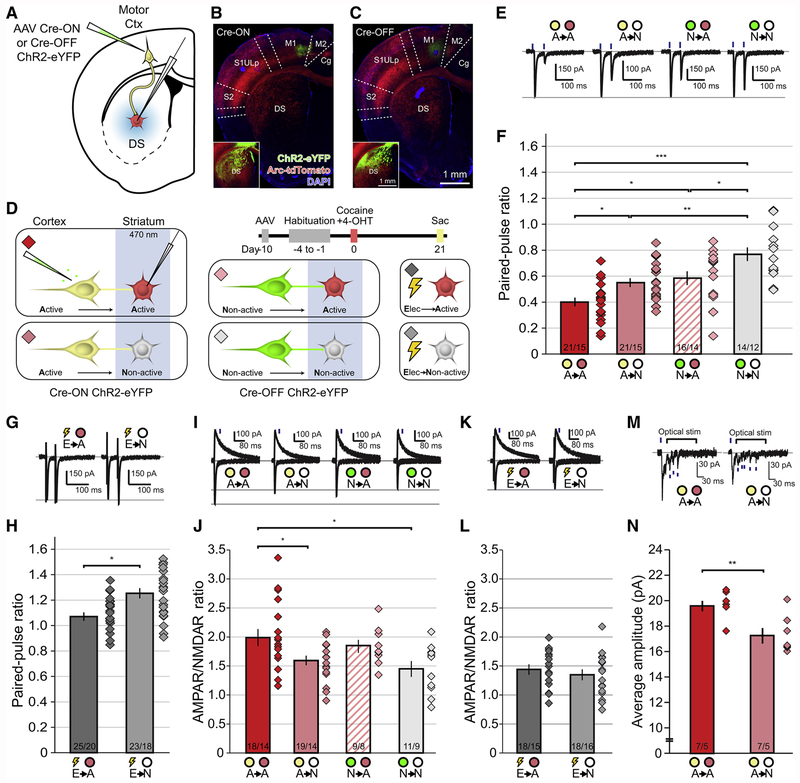
Figure 4. Enhanced Synaptic Strength Between Cocaine-activated Corticostriatal Neurons and Co-activated Striatal Cells.
(A) Complementary targeting strategy for optogenetic stimulation of axon terminals and electrophysiological recording from downstream DS neurons.
(B) Injection site of AAV Cre-ON ChR2-eYFP into motor cortex, with high-exposure inset showing fibers in DS.
(C) As in B, but for Cre-OFF ChR2. Scale bars apply to (B-C).
(D) Timeline and targeting strategy for stimulating axon terminals arising from either cocaine-activated (Cre-ON ChR2, yellow) or non-activated (Cre-OFF ChR2, green) motor corticostriatal neurons while recording from either cocaine-activated (red) or non-activated (gray) DS neurons. Nonspecific electrical stimulation was also performed while recording from cocaine-activated or non-activated DS neurons. Diamonds indicate recording conditions, matched to all subsequent panels.
(E) Representative EPSCs in response to paired-pulse optogenetic activation of corticostriatal axons while recording from either cocaine-activated or non-activated DS neurons.
(F) Paired-pulse ratios for all active and non-active synapse conditions. Diamonds illustrate ratio for individual cells. (Means significantly different via one-way ANOVA F(3,68)=12.49; A→A vs A→N, A→A vs N→A, N→A vs N→N: p<0.05; A→N vs N→N: p<0.01; A→A vs N→N p<0.001, Tukey’s post-hoc test).
(G) Representative EPSCs in response to paired-pulse electrical stimulation. (E→A vs E→N: t(46)=2.63, p<0.05, two-tailed t-test).
(H) Electrically evoked paired-pulse ratios for all active and non-active synapse conditions.
(I) Representative EPSCs at −70 mV and +50 mV generated by optogenetic stimulation of corticostriatal axons. Blue lines indicate time at which measurements were made for NMDAR EPSCs.
(J) AMPAR/NMDAR ratios for all recording conditions. (Means different via one-way ANOVA, F(3, 53) = 3.24; A→A vs A→N, A→A vs N→N p<0.05, Dunnett’s post-hoc test).
(K) Representative EPSCs at −70 mV and +50 mV generated by local electrical stimulation.
(L) AMPAR/NMDAR ratios for all electrical recording conditions. (E→A vs E→N: t(34)=0.9720, p=0.34).
(M) Representative traces of Sr2+-mediated asynchronous miniature EPSCs (blue lines) when optogenetically stimulating cocaine-activated motor corticostriatal neurons while recording from either cocaine-activated or non-activated DS neurons.
(N) Amplitude of miniature EPSCs for all recording conditions. (A→A vs A→N: t(12)=3.424, p=0.005).
* p <0.05, ** p<0.01, *** p<0.001; n/m values at bottom of bars in (F, H, J, L, N) indicate neurons/animals. Bars indicate mean ± 1 SEM.

