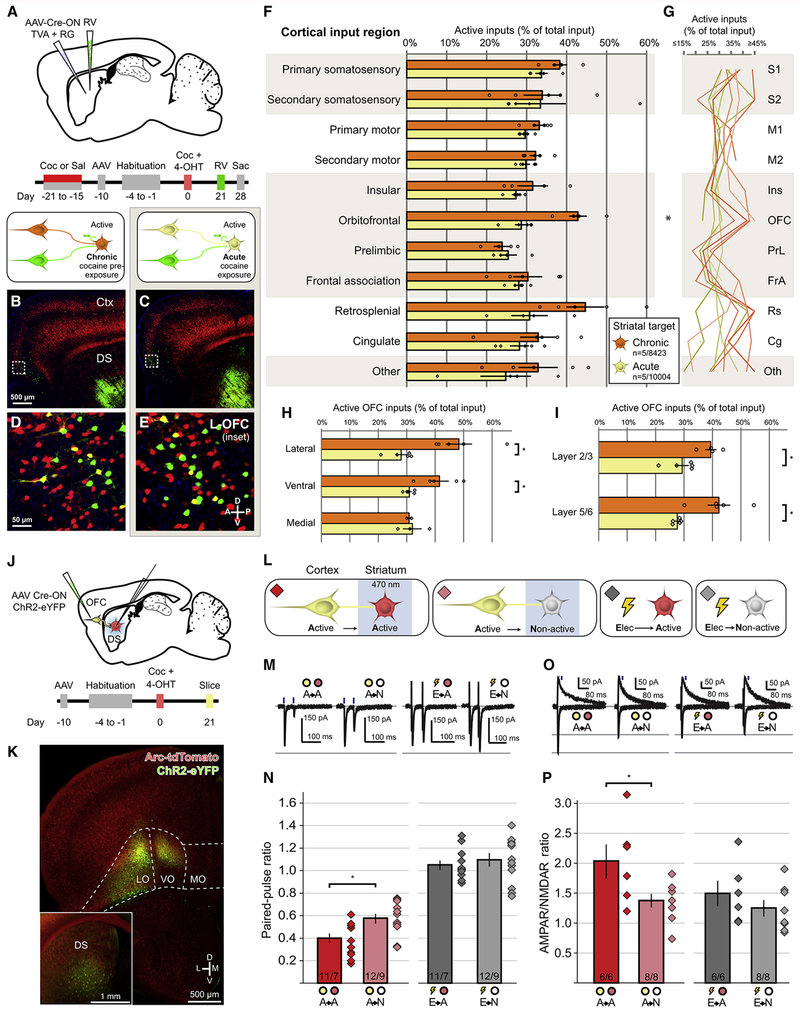
Figure 5. Chronic Cocaine Enhances the Connectivity Between Cocaine-activated OFC Neurons and Cocaine-activated Striatal Neurons.
(A) Strategy and timeline for assessing monosynaptic connectivity to cocaine-activated DS neurons in animals previously exposed to 1 week of cocaine or saline beginning 3 weeks prior to acute cocaine challenge.
(B-C) Arc-dependent tdTomato expression (red) and RV-labeled neurons (green) in mice exposed to chronic cocaine (B) or to acute cocaine (C). Scale bar applies to (B-C).
(D-E) Inset of hatched squares in (B-C), depicting monosynaptic cortical inputs arising from OFC. Scale bar applies to (D-E).
(F) Proportion of monosynaptic inputs onto cocaine-activated DS neurons arising from cocaine-activated corticostriatal neurons in response to acute cocaine treatment in animals that had previously been administered cocaine (chronic, n=5 animals, 8423 neurons) or saline (acute, n=5 animals, 10004 neurons). All bars in this figure indicate mean ± 1 SEM. Treatment groups significantly different via two-way ANOVA, Chronic vs. Acute: F(1,83) =13.38, p<0.001. OFC means significantly different (multiplicity-adjusted p=0.03 using Sidak’s method).
(G) Individual animal data displayed in (F), where each animal is a separate line.
(H) Chronic cocaine pre-exposure enhances connectivity of cocaine-activated neurons in lateral and ventral OFC (Lateral: t(8)=4.086, p=0.01, Ventral: t(8)=3.203, p=0.02 adjusted using Sidak’s method).
(I) Chronic cocaine pre-exposure enhances connectivity of cocaine-activated OFC neurons across cortical layers (OFC Layer 2/3: t(7)=3.232, p=0.01; OFC Layer 5/6: t(8)=3.716, p=0.01 adjusted using Sidak’s method).
(J) Strategy and timeline for assessing synaptic connectivity arising from cocaine-activated OFC neurons to complementary populations of DS neurons.
(K) Injection site of Cre-ON ChR2 into OFC, with high-exposure inset showing fibers in DS.
(L) Strategy for recording responses between cocaine-activated OFC corticostriatal neurons (yellow) and either cocaine-activated (red) or non-activated (gray) DS neurons, as well as synaptic responses to electrical stimulation.
(M) Representative EPSCs in response to paired-pulse optogenetic or electrical activation of corticostriatal axons while recording from either cocaine-activated or non-activated DS neurons.
(N) Paired-pulse ratios for all recording conditions (A→A vs A→N: t(21)=2.80, p=0.01; E→A vs E→N: t(21)=0.66, p=0.52).
(O) Representative EPSCs at −70 mV and +50 mV generated by optogenetic or electrical stimulation of corticostriatal axons.
(P) AMPAR/NMDAR ratios for all recording conditions (A→A vs A→N: t(12)=2.35, p=0.04; E→A vs E→N: t(12)=1.05, p=0.32).
* p <0.05, ** p<0.01; n/m values at bottom of bars in (N, P) indicate neurons/animals. See also Figure S4.

